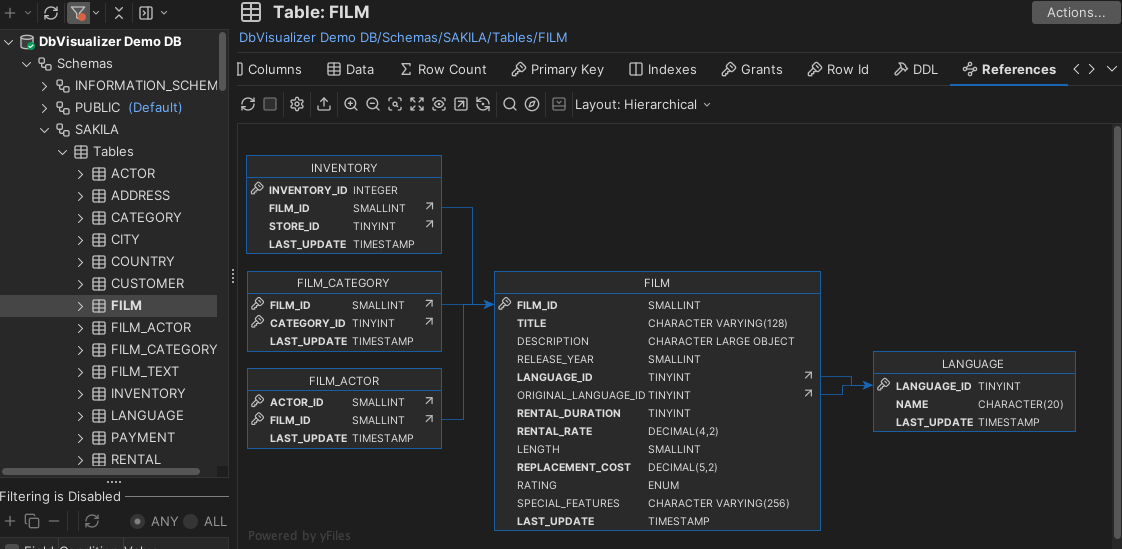
Viewing Table Relationships
Use the References graph to see how a table is related to other tables through Foreign Keys. This is done by selecting the References sub tab of the Database object view, as further described below
You can view relations to/from one or more tables in different graph layouts: Hierarchical, Organic, Orthogonal, or Circular.Layout settings can be changed in the Graph Control area, which is shown or hidden with the settings toggle button in the toolbar. For instance, you can select how much information to include for each table in the graph: just the Table Name, the Primary Key column(s) or all Columns, which links to include, and whether or not to highlight links for selected tables. Settings vary slightly depending on whether you are viewing relations for a single table or multiple tables, and some settings (e.g. Links to Columns) are only available in Hierarchical layout.
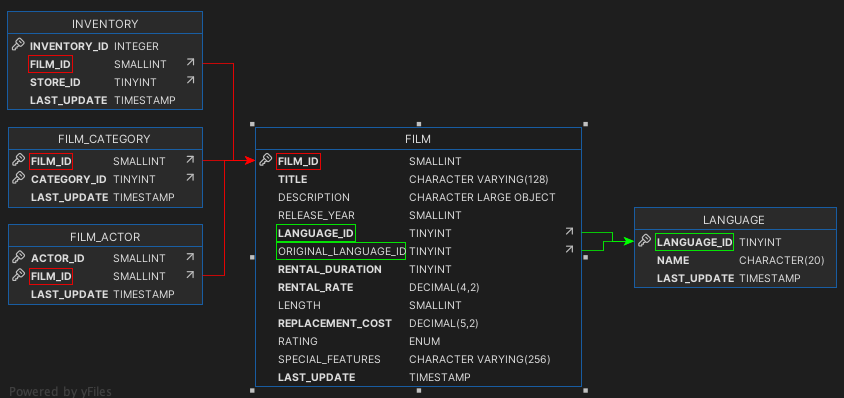
If you choose the Hierarchical layout and select Links to Columns and Highlight Links, the graph will for all selected table nodes color code links and columns to indicate usage:
- foreign key columns and outbound links are green
- primary key columns and inbound links are red
- bidirectional columns (used for both inbound and outbound links) and bidirectional links (where both source and target tables are selected) are orange
The graph can be Exported to a file in JPG, GIF, PNG, SVG, PDF or EMF. It can also be saved s a GML (Graph Modeling Language) file that you can then open in the yEd tool from yWorks for further manipulation. The GML format is saved using Save As in the right-click menu. You can also control whether the table names should be qualified with the schema/catalog in the graph.
When opened on a single table, the graph will only show links to/from this table. You can choose which links to show: Inbound, Outbound, All, or None.
You can also view entity relationships to get an overview of multiple tables.
- Locate the desired table in the Databases tab tree
- Open the table's Object View tab (right-click -> Open in Tab)
- Select the References sub tab

By selecting one or more tables, links and columns are highlighted using colors to indicate usage.

By selecting (clicking on) a specific relation, the corresponding table columns are highlighted:

Check Viewing Entity Relationships section for information about the references graph showing all tables in a schema.