Analyzing (explain) Query Performance
Only in DbVisualizer Pro
This feature is only available in the DbVisualizer Pro edition.
You can analyze how a query is executed by the database, e.g. whether indexes are used or if the database has to do an expensive full scan. To analyze a query:
- Enter the query in the SQL Commander editor,
- Click Execute Explain Plan button in the toolbar,
- Look at the result in the results area.
Explain Plan is supported for DB2 LUW, H2, JavaDB/Derby, Mimer SQL, MySQL, Netezza, NuoDB, Oracle, PostgreSQL, Amazon Redshift, SQLite, Microsoft SQL Server and Vertica.
The available presentations options vary per database as shown in this table.
| Database | Graph Format | Tree Format | Text Format | Node Cost Coloring (Graph and Tree only) |
|---|---|---|---|---|
| DB2 LUW |  |  |  | |
| H2 |  | |||
| JavaDB/Derby |  | |||
| Mimer SQL |  |  |  | |
| MySQL |  |  |  |  |
| Netezza |  | |||
| NuoDB |  | |||
| Oracle |  |  |  |  |
| PostgreSQL |  |  |  |  |
| Amazon Redshift |  | |||
| SQLite |  | |||
| Microsoft SQL Server |  |  |  | |
| Vertica |  |
Explain Plan executes your query and records the plan that the database devises to execute it. By examining this plan, you can find out if the database is picking the right indexes and joining your tables in the most efficient manner. The explain plan feature works much the same as executing SQLs to present result sets; you may highlight statements, run a script or load from file. The explain plan results can easily be compared by pinning the tabs for different runs.
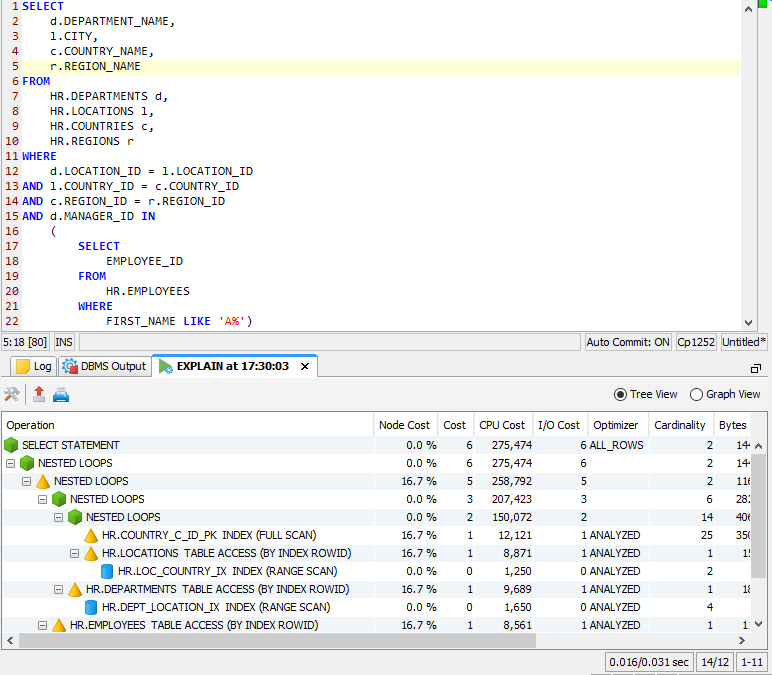
DbVisualizer presents the plan either in a tree style format or in a graph, or in a simple text format. What information is shown depends on the database you use. In the tree view, put the mouse pointer on the column header for a tooltip description what that column represents. The following screenshot shows the SQL in the editor at top and the corresponding explain plan as the result.

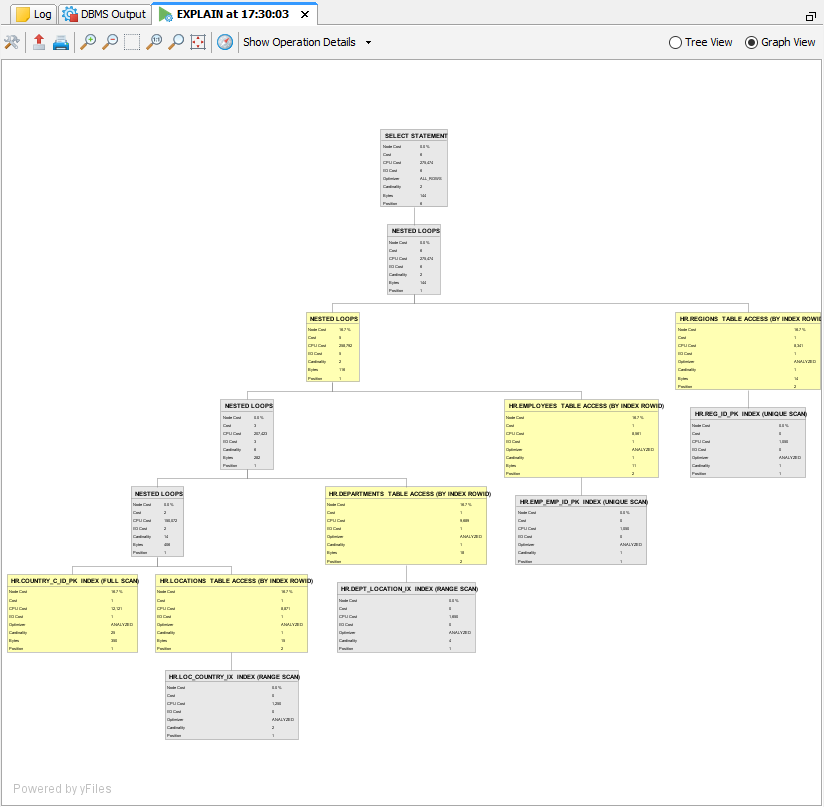
The Graph View shows the plan as a graph. The graph can be exported to an image file or printed. Use the menubar buttons to export and print.

The databases use different techniques to manage their explain plan support. You can make database-specific configurations in the Properties tab for a connection, in the Explain Plan category.