Exporting a Grid
You can export the data in any grid, such as a result set or the Data tab of a table, to a file, the clipboard or SQL Commander. Use one of these, in the grid toolbar or the right-click menu:
- Export exports the rows and columns shown in the grid, with its filters, sorting and column order.
- Export Selection exports the selected cells.
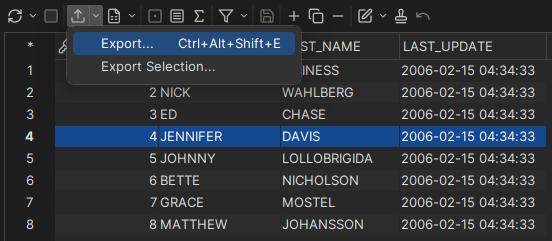
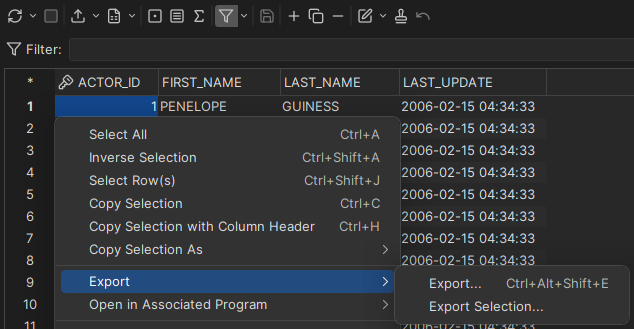
The export is done in a wizard. You choose the format and settings, the columns and values (only in DbVisualizer Pro), preview the result, and choose the destination. To open the grid in a spreadsheet or a web browser with preset settings instead, see Opening a grid in a spreadsheet or browser.
Choosing the format and settings
On the first page, choose the Output Format, the encoding, and the formats of dates, numbers and other values. Next to each data format, an example shows what the values will look like. The encoding is also written in the header of HTML and XML files.
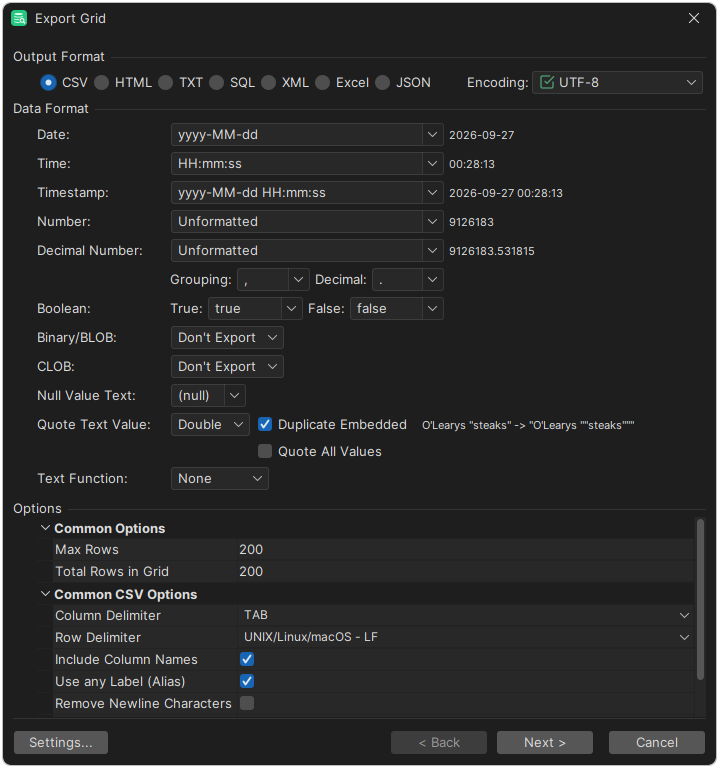
In DbVisualizer Free, you can only export to CSV and HTML.
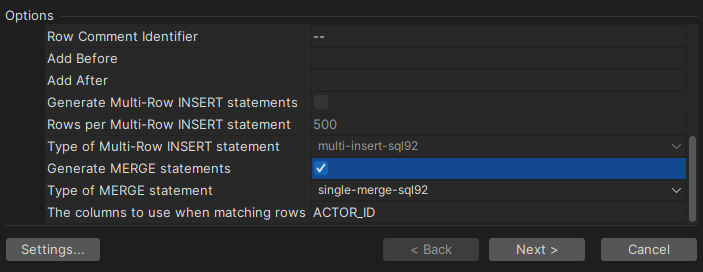
Under Options, set the options for the format, such as the column and row delimiters for CSV. To export only some rows, set Max Rows. For SQL, you can choose qualifiers and delimiters, and whether to write separate or combined INSERT statements. If the grid comes from a single table, you can also write MERGE statements. SQL isn't offered for grids that don't come from a query. See also Exporting to SQL.
Choosing the columns and values
Only in DbVisualizer Pro
This feature is only available in the DbVisualizer Pro edition.
On the Data page, choose the columns to export, and how to write their values. The list has the columns of the grid, in the same order. Columns you have hidden in the grid aren't listed.
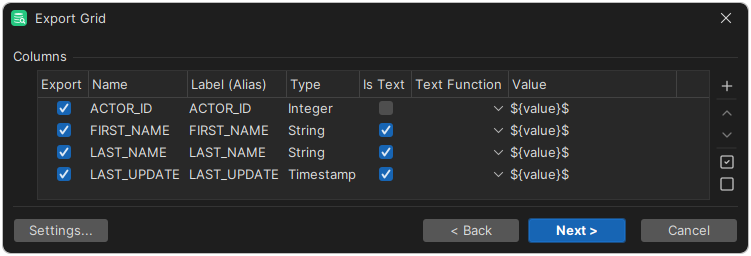
| Column | Description |
|---|---|
| Export | Whether to export the column. |
| Name | The name of the column, used in the HTML, XML, Excel, JSON and SQL formats, and optionally as the header in CSV and TXT. |
| Label (Alias) | The column alias in a result set, if the query has one. To use it instead of the name, select Use any Label (Alias) under Options on the first page. |
| Type | The data type of the column, which decides whether it is a text column. |
| Is Text | Whether the values are text, and are written in quotes. |
| Text Function | Whether to trim spaces from the values: Trim, Right Trim or Left Trim. |
| Value | What to write for the column. The default, ${value}$, is the value in the grid. You can add text before and after it, or use a test data generator. |
To add a column, for example for test data, click Insert New Row. To change the order of the columns, use Move Up and Move Down.
Generating test data
To export generated values instead of, or in addition to, the values in the grid, use a test data generator in the Value column. To insert one, right-click the Value field while you edit it.
| Generator | Value | Result |
|---|---|---|
| Generate random number | ${var||randomnumber(1, 2147483647)}$ | A random number between 1 and 2147483647. |
| Generate random string of random length | ${var||randomtext(1, 10)}$ | Random text with 1 to 10 characters. |
| Generate random value from a list of values | ${var||randomenum(v1, v2, v3, v4, v5)}$ | One of the values in the list, picked at random. |
| Generate sequential number | ${var||number(1, 2147483647, 1)}$ | A number that starts at 1 and increases by 1 for each row. |
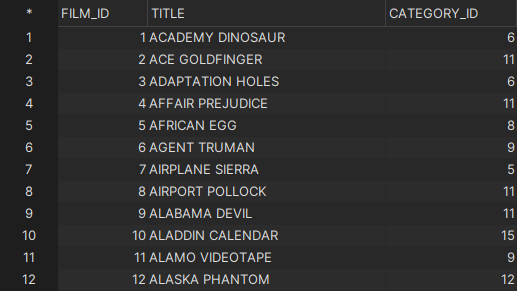
For example, to try out a new column CATEGORY_CODE in place of CATEGORY_ID in this data:
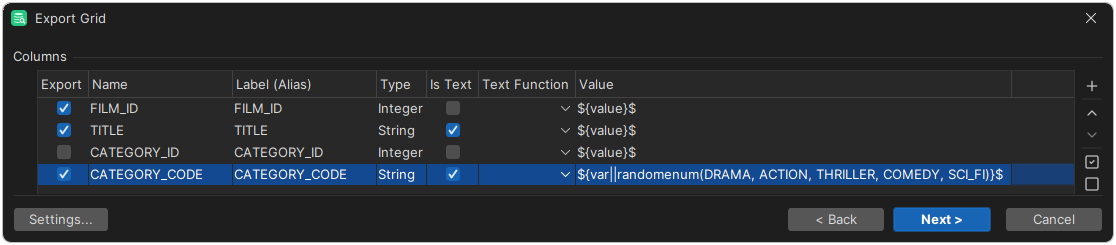
Clear Export for CATEGORY_ID, and set the Value of CATEGORY_CODE to ${var||randomenum(DRAMA, ACTION, THRILLER, COMEDY, SCI_FI)}$.
Previewing the export
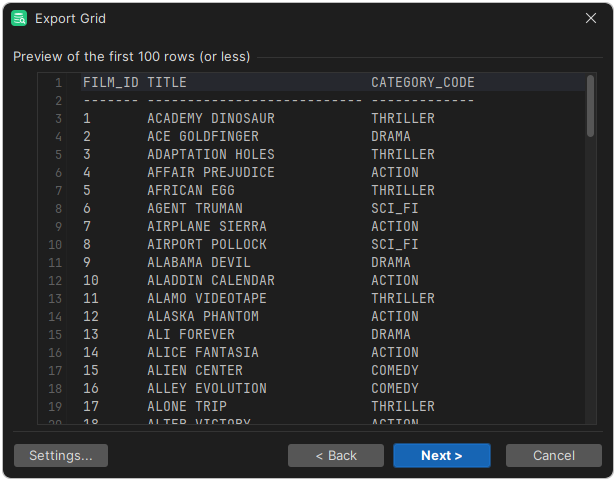
The Preview page shows the first 100 rows as they will be exported. To change the settings, click Back. In TXT format, the example above looks like this:
Choosing the destination
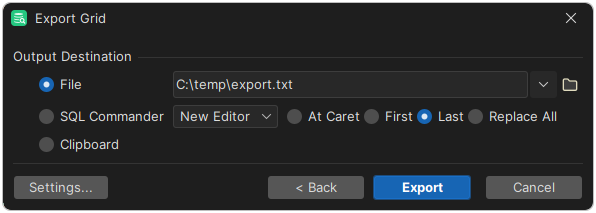
On the Output Destination page, choose to export to a file, SQL Commander or the clipboard, and click Export.
Exporting to Excel
Excel doesn't keep the formats of dates, times and timestamps. To get the right format, select Export Date/Time as Text, or set the format in Excel.
The Excel formats have these limits:
- A text value can have at most 32,767 characters. If a value is longer, the export stops with an error. To export longer values, shorten them in a query, for example using
SUBSTR, or export to CSV instead. - XLSX allows at most 1,048,576 rows in a sheet.
- XLS allows at most 65,535 rows and 256 columns in a sheet.
Saving the settings
If you often use the same settings, save them, using the Settings menu button:
- Save As Default Settings: Use the current settings as the defaults the next time you open the dialog.
- Use Default Settings: Go back to the saved default settings.
- Remove Default Settings: Remove the saved defaults, and go back to the original defaults.
- Save As and Load: Save the settings to a file, and load them from a file.
- Copy Settings to Clipboard: Copy the settings, for example to use them in a script.
You can also use the saved settings with the @export command.
Opening a grid in a spreadsheet or browser
Only in DbVisualizer Pro
This feature is only available in the DbVisualizer Pro edition.
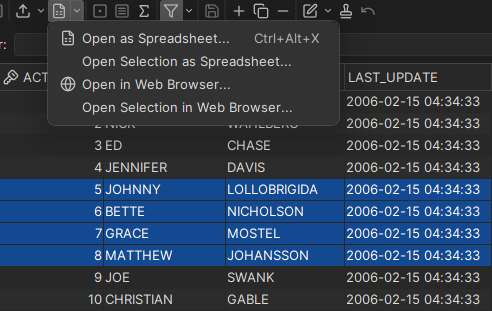
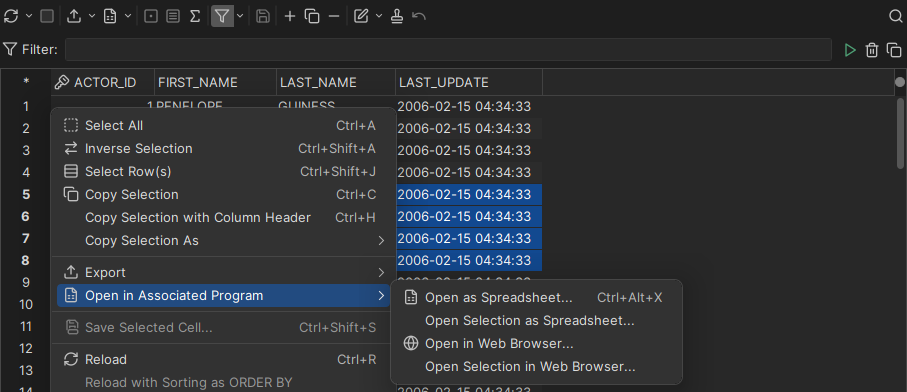
To open the data of a grid in your spreadsheet application, such as Excel, or in your web browser, without choosing settings, use one of these in the grid toolbar or the right-click menu:
- Open as Spreadsheet and Open in Web Browser open the rows and columns shown in the grid.
- Open Selection as Spreadsheet and Open Selection in Web Browser open the selected cells.
A spreadsheet also gets a sheet with the SQL query that produced the data.