Using the Chart View
Only in DbVisualizer Pro
This feature is only available in the DbVisualizer Pro edition.
You can show any result set in SQL Commander, or in a monitor, as a chart.
Showing a result set as a chart
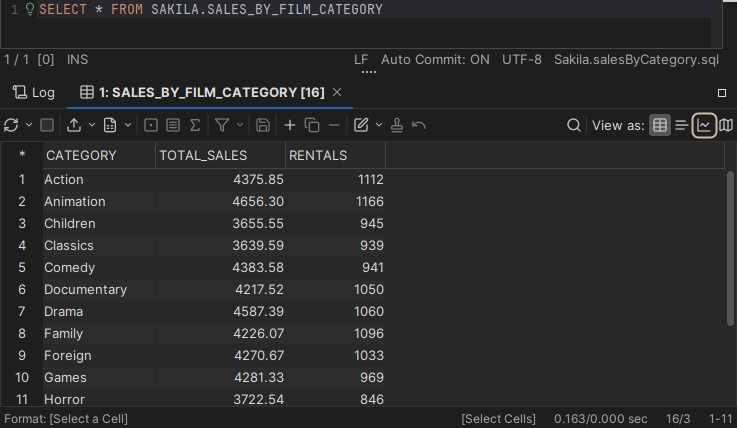
To show a result set as a chart, click the chart button at the upper right of the result set toolbar. See also Viewing a Result Set.
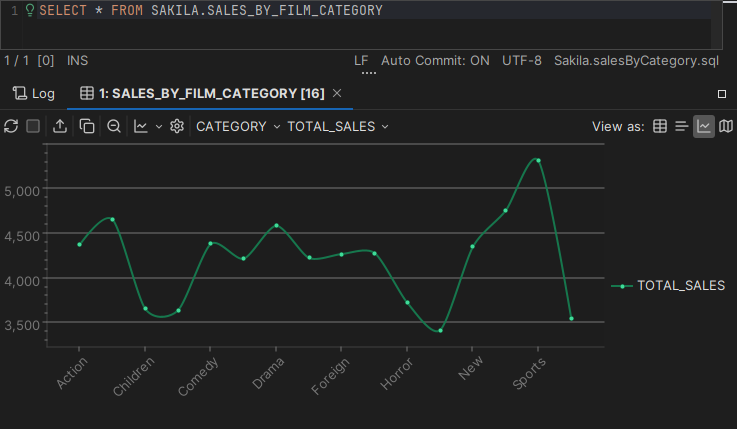
DbVisualizer picks the first date or text column as the category, on the x-axis, and the first numeric column as the series, on the y-axis.
Choosing the category and series
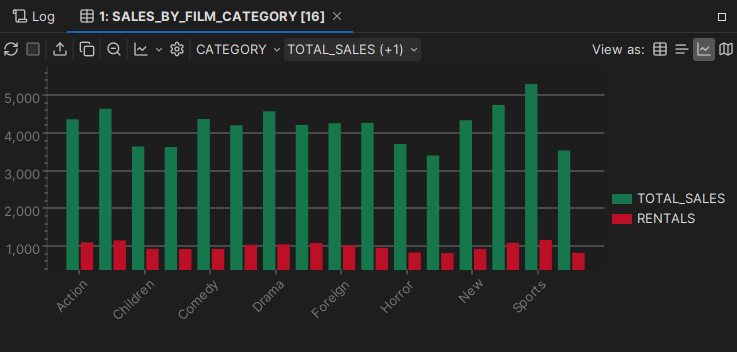
To choose the category, click the category button in the chart toolbar and select a column.
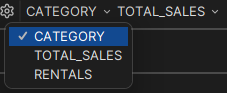
To choose the series, click the series button and select one or more columns. Only numeric columns can be series. The chart is updated as you select. To close the list, press Esc or click outside it. To clear the other series while you select one, hold down Alt.
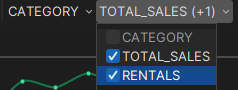
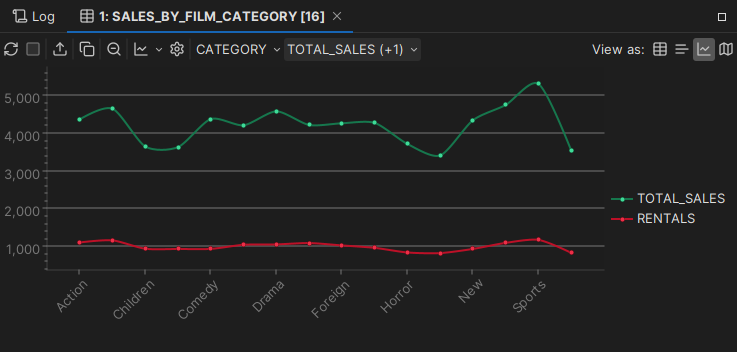
The button shows the name of the first series, and the number of other series, for example SALES (+2).
Choosing the chart type
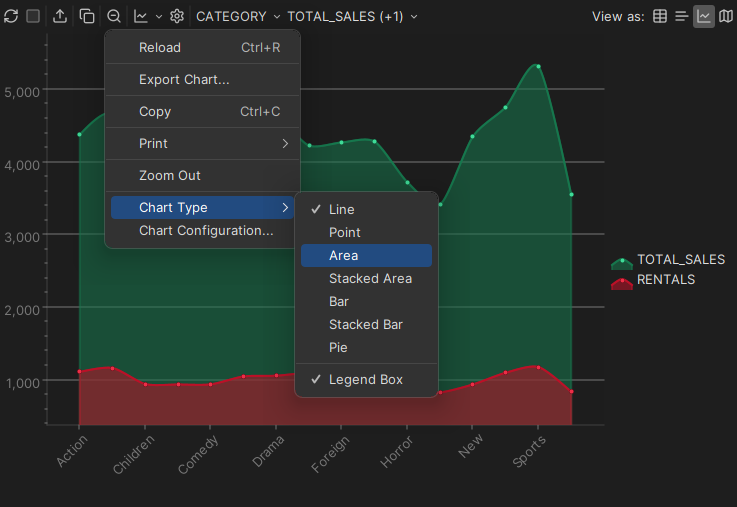
To choose the chart type, use Chart Type in the chart toolbar or in the right-click menu: Line, Point, Area, Stacked Area, Bar, Stacked Bar or Pie. A pie chart shows only one series. In the same menu, Legend Box shows or hides the legend.
Configuring the chart
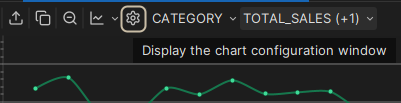
To change titles, colors, the legend position and more, click Chart Configuration in the chart toolbar or the right-click menu.
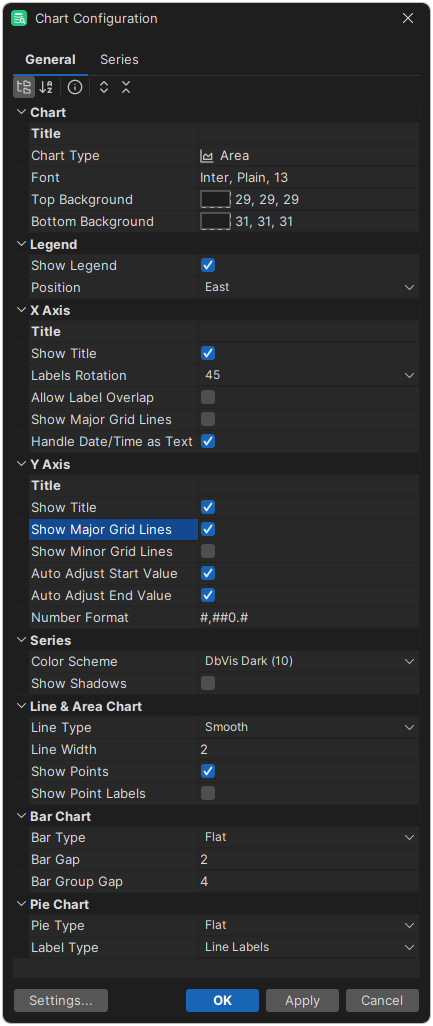
- In the General tab, set the layout and style of the chart. To see a description of the selected setting, click the information button.
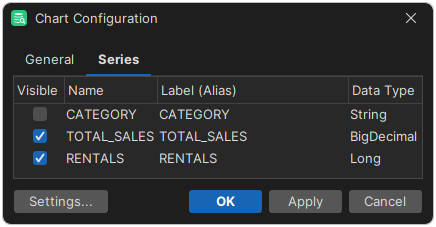
- In the Series tab, choose which series to show, and give them other names than the column names. The tab also shows the data type of each column.
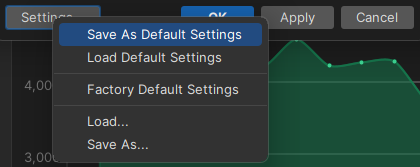
The configuration is used for the next queries in the same SQL Commander tab until you restart DbVisualizer. When you save the script, the configuration is saved with it. To save the configuration as the default, load the default or the factory settings, or save and load the configuration as a file, click Settings at the lower left of the dialog.
Zooming
To zoom in, drag a rectangle in the chart. You can zoom in more by dragging another rectangle. To zoom out one step, click Zoom Out.
Exporting, printing and copying
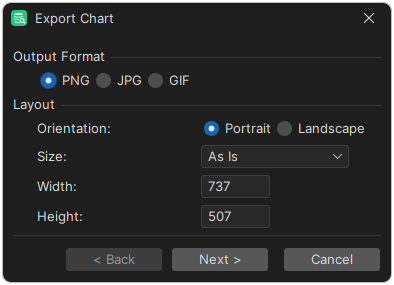
- To save the chart as a PNG, GIF or JPG image, click Export Chart. By default, the image has the size of the chart on the screen. To change it, select a paper size and orientation, or enter a size in pixels.
- To print the chart, right-click it and select Print or Print Preview.
- To copy the chart to the clipboard, click Copy.