Using the Grid Viewers
Next to a grid, such as a result set or the Data tab of a table, you can show the following viewers:
- The value viewer shows the value of the selected cell, as text, an image or another format.
- The record viewer shows all values of the selected row, with the columns as rows.
- The aggregates viewer shows aggregates, such as the sum and the average, of the selected cells.
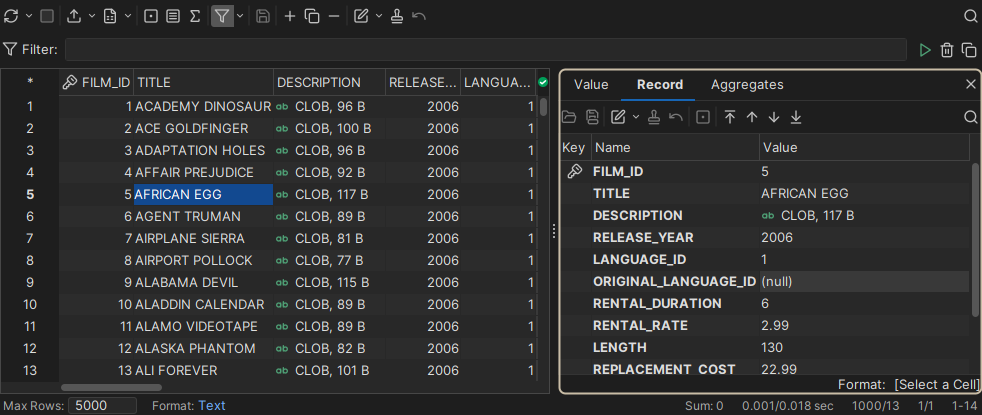
By default, the viewers are shown as tabs to the right of the grid. To show them in separate windows instead, change Grid Viewers Appearance in the General / Grid / Grid Viewers category in Tools → Tool Properties.
When the grid can be edited, you can also edit the values in the value viewer and the record viewer. A change in a viewer is shown in the grid at once, and the other way around.
Value viewer
The value viewer shows the value of the selected cell in a format that fits it: text, XML, JSON, PDF, an image (GIF, JPEG, PNG, TIFF, BMP or SVG), a serialized Java object, HEX, or a date or time.
To open it, do one of the following:
- Click Value Viewer () in the grid toolbar, or select Value Viewer in the right-click menu of the grid.
- Double-click a cell with a CLOB or binary value, with line breaks or tabs, or with text that is cut off by Max Chars.
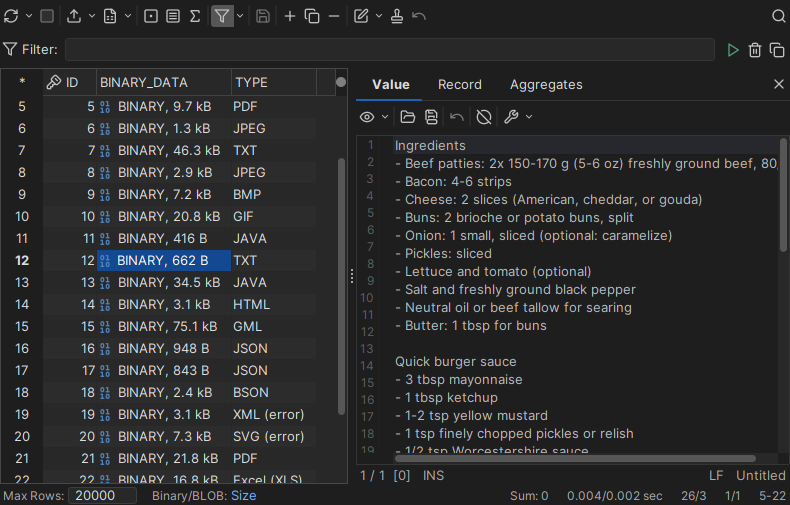
The value viewer finds the type of the content and chooses the viewer. To choose another one, click the eye icon at the left of its toolbar. Only the viewers that fit the data type of the cell are available.
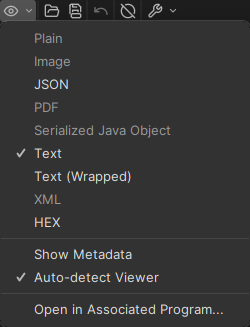
The same menu has the following options:
- Show Metadata shows the data type and other information about the column below the value.
- Auto-detect Viewer shows XML and JSON in a structured viewer instead of as plain text.
To load the content of a file into the cell, drop the file on the value viewer.
By default, text values are shown using the grid font. If you often work with values that contain code, select Use Text Editor Font in the General / Grid / Grid Viewers category in Tools → Tool Properties.
Editing JSON values
By default, JSON is shown as a tree. To change a value, double-click it in the tree. To delete a key or an array element, with all values in it, select it and click Delete () in the toolbar, or right-click it and select Delete. You can also edit the whole value in the cell in the grid.
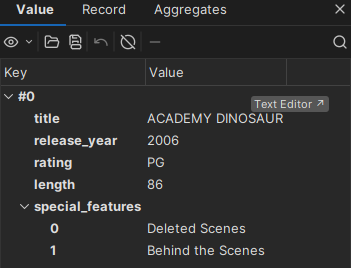
To edit the JSON as text, click Text Editor at the upper right of the tree.
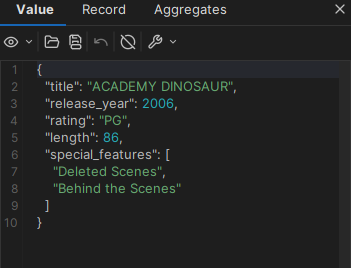
To change the colors of the JSON text, use the Token Styles tab in the General / Appearance / Editor Styles category in Tools → Tool Properties, and select JSON in the Syntax list. See Customizing the SQL Editor.
Record viewer
The record viewer shows the selected row with the columns as rows. This is useful for grids with many columns.
To open it, do one of the following:
- Click Record Viewer () in the grid toolbar, or select Record Viewer in the right-click menu of the grid.
- Double-click the row number to the left of the row.
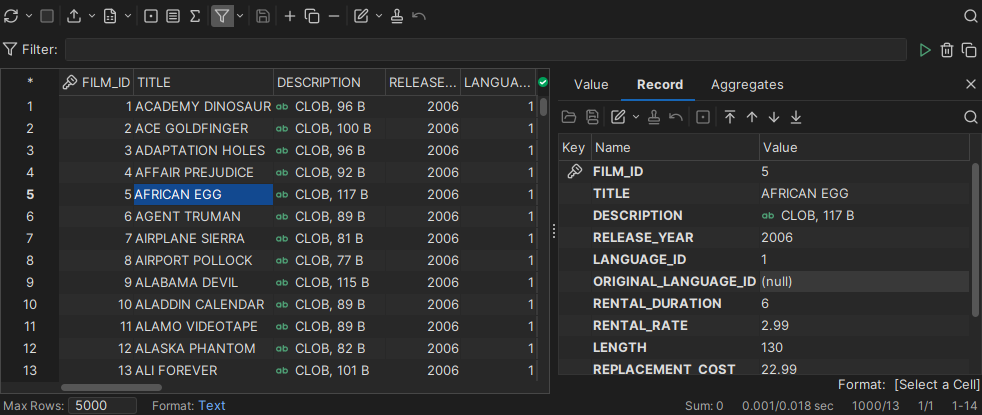
The Key column has a key icon for the columns in the primary key. To see the data type and other information about a column, hover over its name. To go to another row, use the buttons in the toolbar.
CLOB and binary values are shown as an icon and their size. To view or edit such a value, double-click it to open it in the value viewer. Pending changes are marked using the same colors as in the grid.
To align numbers to the right, or to change the size of image thumbnails, use the General / Grid / Grid Viewers category in Tools → Tool Properties.
Aggregates viewer
Only in DbVisualizer Pro
This feature is only available in the DbVisualizer Pro edition.
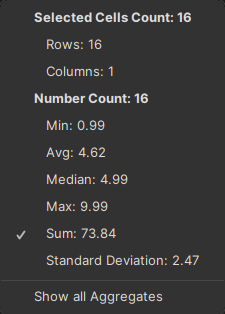
The aggregates viewer shows aggregates of the selected cells, grouped by data type, for example the sum and the average of numbers, and the length of text values. It is updated when you change the selection.
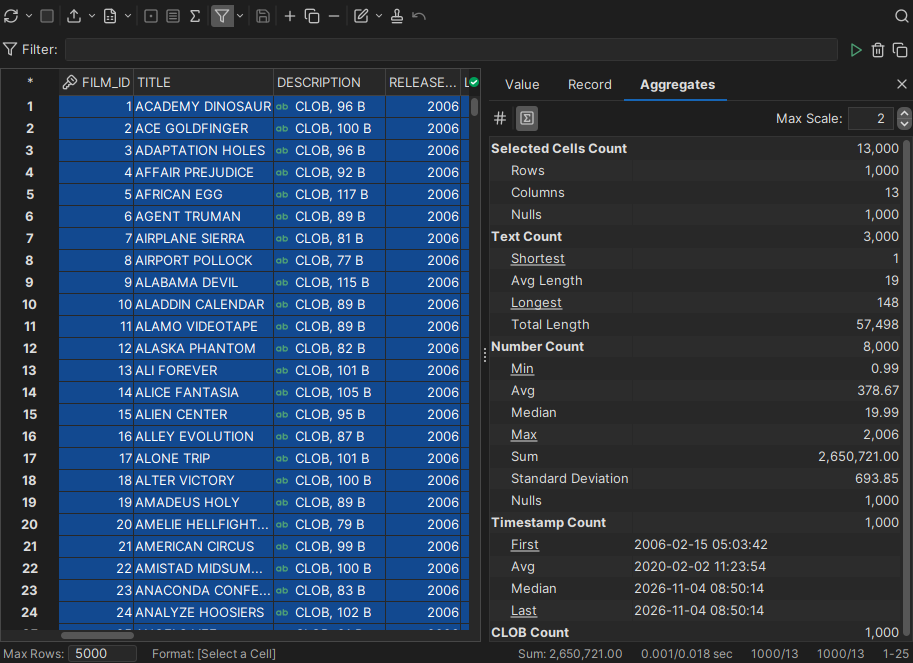
To show the cell of an underlined value, such as the maximum, click the value. The cell is selected in the grid.
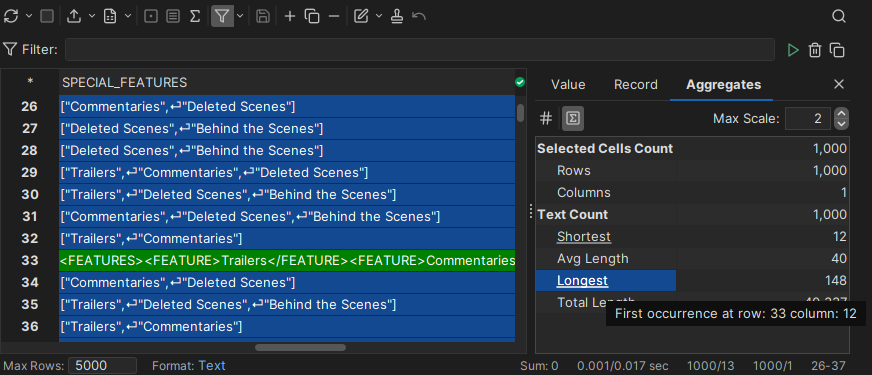
The toolbar has the following buttons:
- Detect Numbers () treats numbers in text columns as numbers.
- Show Status Bar Aggregation () shows up to three aggregates in the status bar below the grid.
Showing aggregates in the status bar
The status bar below the grid can show up to three aggregates of the selected cells, even when the aggregates viewer is closed. By default, it shows the sum of the numbers.
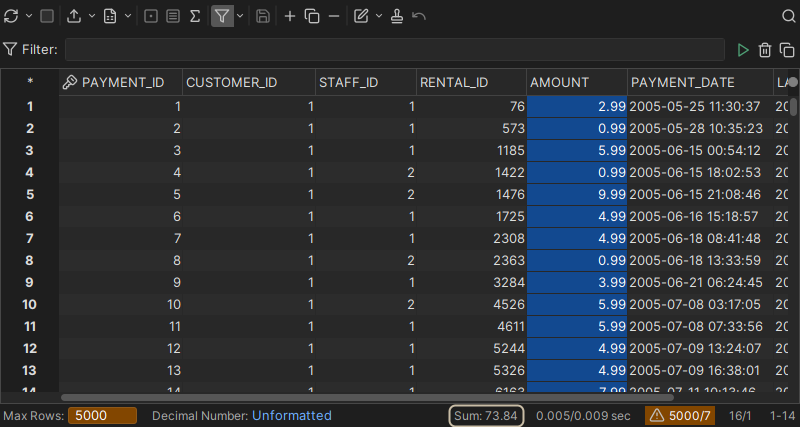
To choose the aggregates, click the status bar entry. To open the aggregates viewer, select Show all Aggregates.