Running a Monitored Query
You run monitors and see their results in the Monitor window. To open it, select Tools → Data Monitor. The window shows the result of each monitor that is set to be visible.
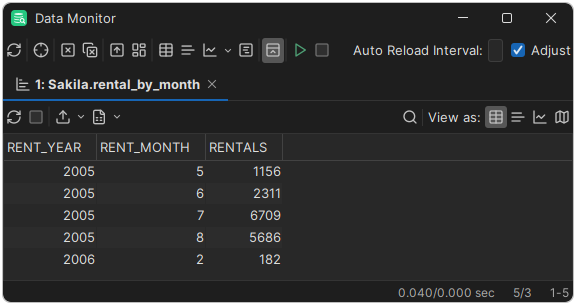
To run the monitors at regular intervals, enter the number of seconds in Auto Reload Interval, by default 300, and click Start. A progress bar counts down to the next run. If running all monitors takes longer than the interval, DbVisualizer increases the interval when Adjust is selected, which it is by default.
In DbVisualizer Free, the results are shown as grids. In DbVisualizer Pro, you can also show them as text or charts.
| Button | Description |
|---|---|
| Reload | Run all monitors once. |
| Locate Data Monitor File | Select the monitor of the selected result in the Files tab. |
| Clear Current Monitor, Clear All Monitors | Clear the selected result, or all results. |
| Show as Tabs, Show as Tiles | Show the results as tabs, or side by side. |
| Show Grids, Show Texts | Show all results as grids or text. |
| Chart Type | Show all results as charts of the chosen type. Legend Box shows or hides the legends. |
| Show/Hide Toolbars | Show or hide the toolbar of each result. |
| Start, Stop | Start or stop running the monitors at the Auto Reload Interval. |
To open the Monitor window, or start the monitors, when DbVisualizer starts, select Show Monitor Window at Startup or Start Monitors Automatically in the General / Monitor category in Tools → Tool Properties. There, you can also choose with Monitor Run Style whether the monitors run one at a time, the default, or in parallel.