intro
By reading this tutorial, you will be introduced to columnar databases and learn how to harness the power of ClickHouse and DbVisualizer to explore columnar databases, execute complex analytical queries, visualize data insights, and drive impactful decision-making.
Introduction to Columnar Databases
Columnar databases have revolutionized the way data is stored and accessed, particularly for analytical and reporting purposes. Unlike traditional row-based databases, where data is stored in rows, columnar databases organize data in columns, leading to significant performance improvements in analytical workloads.
In this tutorial, we will delve into the world of columnar databases, focusing on ClickHouse, a leading columnar database, and how you can explore its capabilities using DbVisualizer.
Prerequisites
To follow this tutorial and explore ClickHouse with DbVisualizer effectively, you will need:
By meeting these prerequisites, you'll be well-prepared to embark on the journey of exploring columnar databases, understanding ClickHouse's capabilities, and harnessing DbVisualizer's features to enhance your data management and visualization skills.
Definition and Benefits of Columnar Databases
Columnar databases store data in a column-wise format, as opposed to the row-wise format of traditional relational databases. This design offers several benefits for analytical workloads, including:
How Columnar Databases Differ from Traditional Row-Based Databases
Traditional databases organize data in rows, primarily suited for handling transactions. However, when performing analytical tasks like aggregations, filtering, and reporting, row-based databases can suffer from inefficiencies. This arises from the need to scan entire rows, even for a limited set of chosen columns.
Columnar databases, in contrast, take a different approach. They store and process data by columns individually, leading to significant performance improvements when executing analytical operations.
Advantages of Columnar Storage for Analytics and Reporting
The advantages of columnar storage are particularly evident when it comes to analytics and reporting:
Overview of ClickHouse
ClickHouse is an open-source, columnar database management system designed for high-performance analytical processing. It was developed by Yandex and is renowned for its speed, scalability, and ability to handle large volumes of data.
Key Features and Capabilities of ClickHouse
ClickHouse offers a range of features that make it a powerful choice for analytical workloads:
Use Cases and Industries that Benefit from ClickHouse
ClickHouse finds applications in various industries, including:
Getting Started with ClickHouse
Installation and Setup of ClickHouse
To get started with ClickHouse, you'll need to install it on your system. The installation process varies depending on your operating system. You can refer to the official ClickHouse documentation for detailed instructions. For this tutorial, we will be covering the quick install steps for Clickhouse on your local device. If you're new to ClickHouse and want to quickly get a feel for its features, you can try out its cloud platform, or you can use the following steps to download and install ClickHouse locally. This method allows you to run the ClickHouse server, client, and other tools with a single binary.
Download ClickHouse Binary: On Linux, macOS, and FreeBSD, open a terminal and run the following command to download and install ClickHouse's single binary:
                    1
                    curl https://clickhouse.com/ | sh
This command will fetch the necessary binary for your operating system and set up the ClickHouse tools.
Start ClickHouse Server:
After the binary is downloaded, you can start the ClickHouse server by running:
                    1
                    ./clickhouse server
This command will open the ClickHouse client, allowing you to interact with the server using SQL queries and statements.
You'll see output similar to the following, indicating that you've successfully connected to ClickHouse:
                    1
                    ClickHouse client version 23.2.1.1501 (official build).


                    2
                    Connecting to localhost:9000 as user default.


                    3
                    Connected to ClickHouse server version 23.2.1 revision 54461.


                    4
                    local-host :)
With ClickHouse successfully installed and running, you are now ready to start sending Data Definition Language (DDL) and SQL commands to the ClickHouse server for data exploration and analysis.
Connecting ClickHouse with DbVisualizer
Step 1: Launch DbVisualizer and open the "Database" menu. Choose the option to "Create a New Connection."

Step 2: Select "ClickHouse" as the database type. This will prompt you to input specific ClickHouse connection details.

Step 3: Enter the connection details you obtained from your ClickHouse server. This includes the host, port, database, username, and password.

Step 4: Navigate to the “Properties” tab, then set the compress to “False” so it can return the full data needed to create the database tree.

Step 5: Return back to the “Connection” tab, then click on “Connect”. You might need to download the ClickHouse JDBC driver before creating a connection if you haven’t already. Navigate to the Driver manager

Click on “Start Download” to download the required JDBC driver for ClickHouse. Once the download is complete, return back to the “Connection” tab and try to connect again.

Step 6: With all the necessary details input, click the "Test Connection" button within DbVisualizer. This will initiate a connection test to ClickHouse using the provided credentials.

If the test is successful, you'll receive a confirmation message indicating that DbVisualizer can connect to ClickHouse using the specified parameters.
Understanding ClickHouse Data Models and Tables
ClickHouse supports a flexible data model with tables, columns, and data types. Tables in ClickHouse are created using SQL statements, and you can define the schema, data types, and constraints. You can explore its database structure and schema using the DbVisualizer object tree.

Loading Data into ClickHouse
ClickHouse supports various methods for loading data, including:
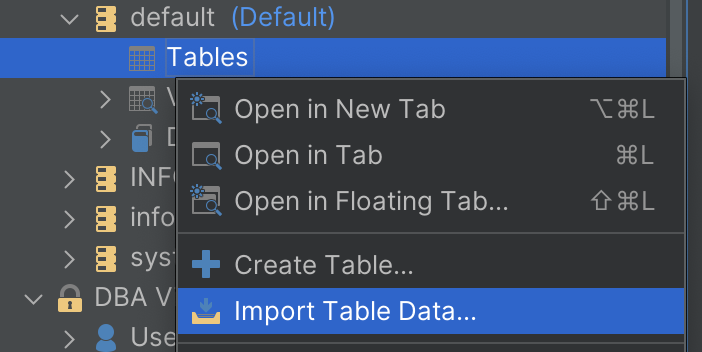
You can also load large datasets into ClickHouse using the DbVisualizer import feature.

Loading data in ClickHouse using DbVisualizer
Querying Data in ClickHouse
Once you have ClickHouse up and running, you're ready to explore its powerful querying capabilities. ClickHouse's columnar storage and optimized query engine make it well-suited for analytical and reporting tasks.
Creating a Table and Loading Sample Data
Before we dive into querying, let's start by creating a simple table in ClickHouse and loading it with sample data:
                    1
                    -- Create a table to store sales data


                    2
                    CREATE TABLE sales (


                    3
                        sale_id Int32,


                    4
                        product_name String,


                    5
                        sales_amount Float64,


                    6
                        sale_date Date


                    7
                    ) ENGINE = MergeTree()


                    8
                    ORDER BY sale_date;


                    9


                    10
                    -- Insert sample data into the sales table


                    11
                    INSERT INTO sales (sale_id, product_name, sales_amount, sale_date)


                    12
                    VALUES


                    13
                        (1, 'Product A', 1000.50, '2023-08-01'),


                    14
                        (2, 'Product B', 750.25, '2023-08-02'),


                    15
                        (3, 'Product A', 1200.75, '2023-08-03'),


                    16
                        (4, 'Product C', 500.00, '2023-08-03'),


                    17
                        (5, 'Product B', 900.00, '2023-08-04');

Basic SELECT Queries
Let's start with some basic SELECT queries to retrieve data from the created table:
                    1
                    -- Select all columns from the sales table


                    2
                    SELECT * FROM sales;


                    3


                    4
                    -- Select specific columns


                    5
                    SELECT sale_id, product_name FROM sales;


                    6


                    7
                    -- Apply WHERE clause to filter data


                    8
                    SELECT * FROM sales WHERE sales_amount > 1000;

Aggregation and Grouping
ClickHouse excels at performing aggregations and grouping operations efficiently. Here are some examples:
                    1
                    -- Calculate the total sum of sales_amount


                    2
                    SELECT SUM(sales_amount) FROM sales;


                    3


                    4
                    -- Count the number of sales records


                    5
                    SELECT COUNT(*) FROM sales;


                    6


                    7
                    -- Group data by product_name and calculate average sales_amount


                    8
                    SELECT product_name, AVG(sales_amount) FROM sales GROUP BY product_name;


Date and Time Functions
ClickHouse provides date and time functions for handling temporal data:
                    1
                    -- Extract year from sale_date


                    2
                    SELECT sale_id, sale_date, YEAR(sale_date) AS sale_year


                    3
                    FROM sales;


                    4


                    5
                    -- Calculate the difference in days between two sale_dates


                    6
                    SELECT toDate('2023-08-31') - toDate('2023-08-15') AS days_between;


These examples showcase just a fraction of ClickHouse's querying capabilities. Its optimized query engine ensures high-speed execution, making it an excellent choice for data exploration and analysis tasks.
Visualizing ClickHouse Data with DbVisualizer
Once you have queried and retrieved the data you need from ClickHouse, the next step is to visualize this data to gain insights and make informed decisions. DbVisualizer offers a range of visualization options to help you create compelling charts, graphs, and reports based on your data. In this section, we'll walk you through an example of generating analytics data from ClickHouse and creating a chart using DbVisualizer.
Below is an example of a SQL query that you can use to generate analytics data suitable for creating a chart in DbVisualizer. For the sake of illustration, let's assume you want to create a bar chart showing the total sales amount for each product category.
Assuming you have a table named sales with columns product_name and sales_amount, here's how you can generate the analytics data:
                    1
                    SELECT product_name, SUM(sales_amount) AS total_sales_amount


                    2
                    FROM sales


                    3
                    GROUP BY product_name


                    4
                    ORDER BY total_sales_amount DESC;
This query calculates the total sales amount for each product by summing up the sales_amount column. The GROUP BY clause groups the results by the product_name column, and the ORDER BY clause orders the results in descending order of total sales amount.

To create a visualization for this table, click on the rightmost button in the result tab toolbar.

Then select the values for the x and y axis of your chart by clicking on the select button above the chart panel. Select the product_name ad the x-axis and total_sales_amount as the y-axis.

By default, the visualization displays a line chart, but don't let that limit you. You can try out options like line chart, point chart, area chart, stacked area chart, bar chart, stacked bar chart, and pie chart by clicking on the chart icon above the chart panel to reveal a dropdown menu of various chart types. Select “Bar” from the drop-down to create a bar chart for your query.


You now have a stunning bar chart ready to impress! DbVisualizer provides various customizable features. To explore, click the tool button at the chart tab's top. Tailor your charts to your liking. Once perfected, effortlessly export as an image with the document icon at the chart tab's top.

Conclusion
In this tutorial, you've explored the world of columnar databases and harnessed the potential of ClickHouse for efficient analytics. Armed with essential prerequisites—SQL knowledge, DbVisualizer, and ClickHouse—you've gained insights into fundamental querying techniques, encompassing table creation, data loading, and advanced function usage.
By harnessing DbVisualizer's visualization prowess, you've transformed raw ClickHouse data into compelling charts. This powerful combination opens the door to boundless opportunities for data-guided decisions and analytical excellence.
As you venture forward, don't hesitate to delve into ClickHouse's official documentation for deeper insights and exploration. Experiment with intricate queries, fine-tune performance and delve into DbVisualizer's rich visualization toolkit. By synergizing the capabilities of ClickHouse and DbVisualizer, you can unleash the full potential of your projects, driving impactful insights that lead to success. So why wait? Start your journey today, exploring, and unleashing the full capabilities of ClickHouse and DbVisualizer by delving into their documentation and blog enriching your data-driven journey. Until our paths cross again, happy exploring!
FAQ
What is ClickHouse, and how does it differ from traditional databases for analytics?
ClickHouse is an open-source columnar database designed for high-speed analytical processing. Unlike traditional row-based databases, ClickHouse's columnar storage structure and vectorized processing make it highly efficient for complex analytical queries and reporting tasks.
How do I install ClickHouse on my system?
To install ClickHouse, you can follow the instructions on the official ClickHouse documentation. For a quick setup, you can download the ClickHouse binary for your operating system and start the ClickHouse server. The documentation provides step-by-step guidance for installation and setup.
What is DbVisualizer, and how can it be used with ClickHouse?
DbVisualizer is a versatile database management and visualization tool. You can use DbVisualizer to connect to ClickHouse and explore its data. By creating a new connection in DbVisualizer, inputting your ClickHouse connection details, and using its visualization tools, you can turn ClickHouse data into insightful charts and reports.
Can you provide an example of a complex analytical query in ClickHouse?
Certainly! Here's an example of a complex analytical query: SELECT product_name, SUM(sales_amount) AS total_sales FROM sales WHERE sale_date BETWEEN '2023-01-01' AND '2023-06-30' GROUP BY product_name ORDER BY total_sales DESC; This query calculates the total sales for each product between January and June of 2023 and displays the results in descending order of sales.
What industries benefit the most from ClickHouse's capabilities?
ClickHouse finds applications in various industries, including e-commerce, finance, IoT, and ad tech. E-commerce businesses can analyze user behavior and sales trends, while financial institutions use ClickHouse for market analysis and fraud detection. IoT applications involve handling high-frequency sensor data, and ad tech relies on ClickHouse for real-time analytics in advertising campaigns.