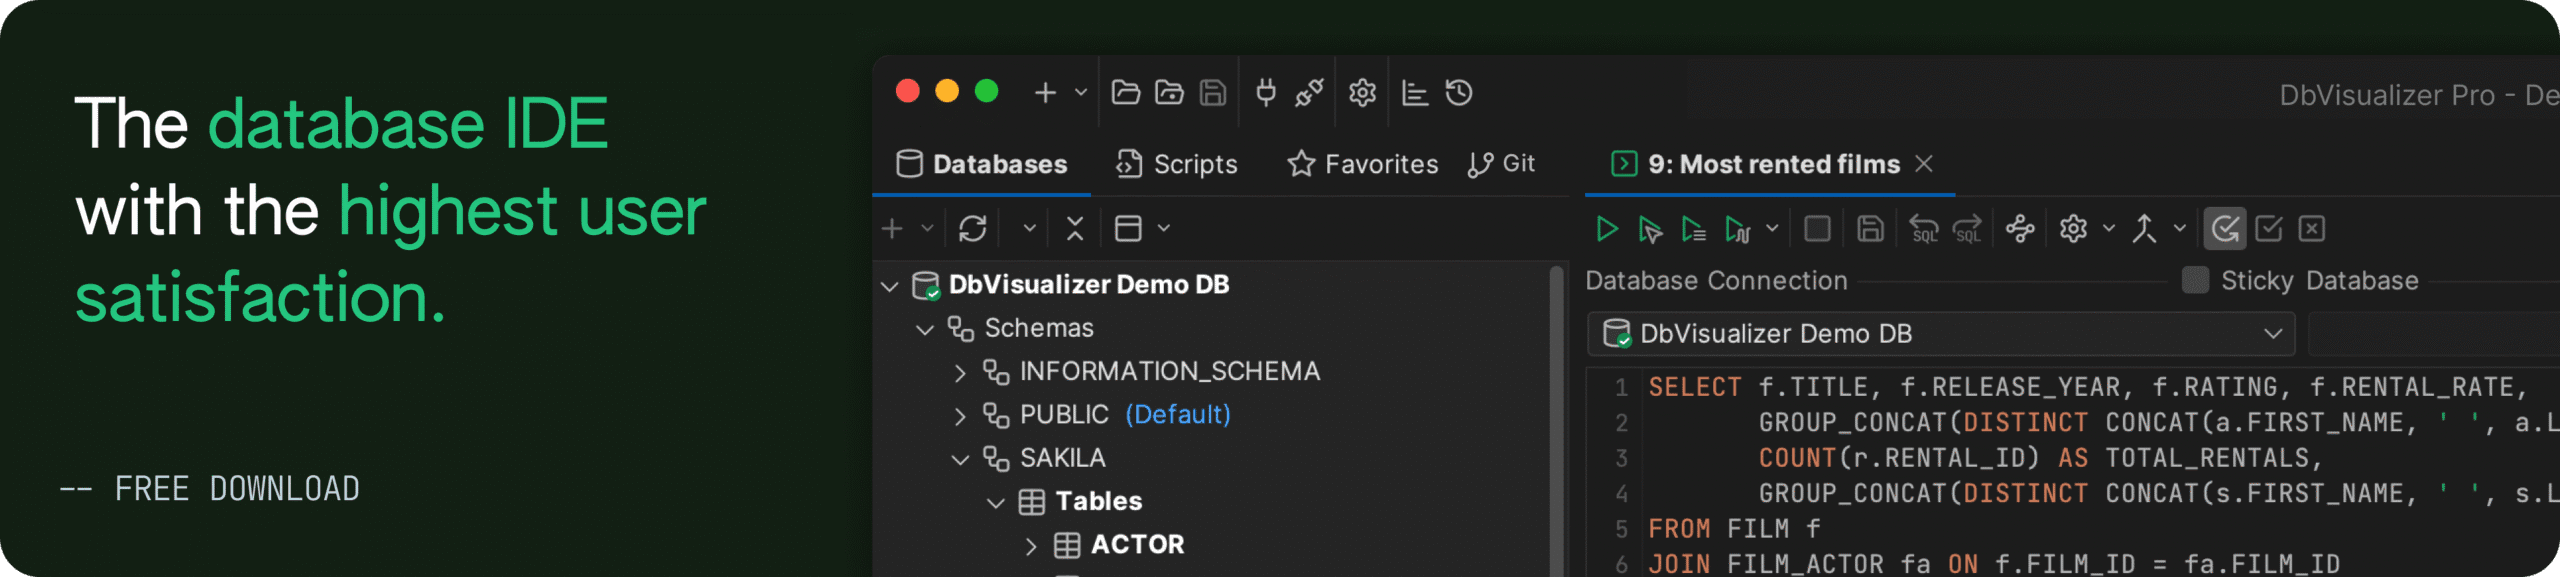
intro
Let’s learn everything you need to know about the SQL EXPLAIN command to understand how databases execute queries and optimize them!
Optimizing SQL queries is always a daunting task. The main problem is that database systems tend to execute queries after many internal steps that are necessary to parse and optimize the query. To find out what internals are being used by your query, you would have to dig into your database and ask it to explain what indexes are in use and what is their length, how many rows are returned by a specific query, and provide other information. This is exactly what the SQL EXPLAIN command is all about!
In this guide, you will understand what an EXPLAIN query is, what data it generates, and which databases support this command.
Let's dive in!
What Is SQL EXPLAIN?
The EXPLAIN command provides insights into how a database will execute a given SQL statement. The features of the command differ depending on what database management system is in use, but in general, it provides information on the query type, partitions, indexes, and their length, as well as how many rows are returned. In some database management systems (in this example, MySQL ≥ 8.0.18), it can also return the execution plan the database will follow to run the statement written after the SQL EXPLAIN keyword. If you are unfamiliar with this concept, an execution plan is a sequence of operations and steps the DBMS will perform to perform the requested query.
That usually includes which tables will be accessed, the order of JOINs between tables, which indexes (if any) will be used, sorting methods, and estimated costs in terms of resource usage. As you can imagine, studying this plan is key for SQL query optimization.
Databases that support the EXPLAIN SQL command include MySQL, PostgreSQL, and Oracle. Each implementation involves different options and output formats, such as JSON, XML, string, or table.
For more information, refer to the official documentation pages below:
How to Get the SQL EXPLAIN Plan of a Query
Time to see how the EXPLAIN commands work in two of the most popular DBMS technologies, MySQL and PostgreSQL!
MySQL
This is the syntax of the MySQL EXPLAIN command:
                    1
                    EXPLAIN [ANALYZE] [FORMAT = TRADITIONAL|JSON|TREE] sql_statement
Where:
Thanks to the EXPLAIN plan SQL command, MySQL explains how it would process the statement, including information about how tables are joined and in which order.
For example, take a look at the MySQL EXPLAIN query below:
                    1
                    EXPLAIN FORMAT=TREE


                    2
                    SELECT *


                    3
                    FROM orders O


                    4
                    INNER JOIN products P ON O.product_id = P.id;
The result will be something like:
                    1
                    -> Nested loop inner join  (cost=2.50 rows=5)


                    2
                     -> Filter: (o.product_id is not null)  (cost=0.75 rows=5)


                    3
                      -> Table scan on O  (cost=0.75 rows=5)


                    4
                     -> Single-row index lookup on P using PRIMARY (id=o.product_id)  (cost=0.27 rows=1)
Instead, the same EXPLAIN ANALYZE query in MySQL would produce:
                    1
                    -> Nested loop inner join  (cost=3.85 rows=8) (actual time=0.139..0.189 rows=8 loops=1)


                    2
                     -> Filter: (o.product_id is not null)  (cost=1.05 rows=8) (actual time=0.043..0.056 rows=8 loops=1)


                    3
                      -> Table scan on O  (cost=1.05 rows=8) (actual time=0.042..0.053 rows=8 loops=1)


                    4
                     -> Single-row index lookup on P using PRIMARY (id=o.product_id)  (cost=0.26 rows=1) (actual time=0.016..0.016 rows=1 loops=8)
This time, time, and loop information are provided as well.
PostgreSQL
The syntax of the SQL EXPLAIN command in PostgreSQL is:
                    1
                    EXPLAIN [ ( option [, ...] ) ] sql_statement
Where:
In particular, the supported options are:
An example of a PostgreSQL EXPLAIN query is:
                    1
                    EXPLAIN ANALYZE VERBOSE


                    2
                    SELECT *


                    3
                    FROM orders O


                    4
                    LEFT JOIN products P ON O.product_id = P.id;
The result will be something like:
                    1
                    Hash Left Join  (cost=1.02..30.93 rows=1570 width=226) (actual time=0.049..0.053 rows=5 loops=1)


                    2
                      Output: o.id, o.product_id, o.amount, p.id, p.name, p.price, p.description, p.tagline


                    3
                      Inner Unique: true


                    4
                      Hash Cond: (o.product_id = p.id)


                    5
                      ->  Seq Scan on public.orders o  (cost=0.00..25.70 rows=1570 width=24) (actual time=0.018..0.019 rows=5 loops=1)


                    6
                      Output: o.id, o.product_id, o.amount


                    7
                      ->  Hash  (cost=1.01..1.01 rows=1 width=202) (actual time=0.019..0.020 rows=5 loops=1)


                    8
                      Output: p.id, p.name, p.price, p.description, p.tagline


                    9
                      Buckets: 1024  Batches: 1  Memory Usage: 9kB


                    10
                      ->  Seq Scan on public.products p  (cost=0.00..1.01 rows=1 width=202) (actual time=0.010..0.012 rows=5 loops=1)


                    11
                         Output: p.id, p.name, p.price, p.description, p.tagline


                    12
                    Planning Time: 0.162 ms


                    13
                    Execution Time: 0.085 ms
Equivalently, the query to get an output in JSON format in non-verbose mode will be:
                    1
                    EXPLAIN (ANALYZE, VERBOSE, FORMAT JSON)


                    2
                    SELECT *


                    3
                    FROM orders O


                    4
                    LEFT JOIN products P ON O.product_id = P.id;
The result will now be:
                    1
                    [


                    2
                      {


                    3
                        "Plan": {


                    4
                          "Node Type": "Hash Join",


                    5
                          "Parallel Aware": false,


                    6
                          "Async Capable": false,


                    7
                          "Join Type": "Left",


                    8
                          "Startup Cost": 1.02,


                    9
                          "Total Cost": 30.93,


                    10
                          "Plan Rows": 1570,


                    11
                          "Plan Width": 226,


                    12
                          "Actual Startup Time": 0.077,


                    13
                          "Actual Total Time": 0.082,


                    14
                          "Actual Rows": 5,


                    15
                          "Actual Loops": 1,


                    16
                          "Inner Unique": true,


                    17
                          "Hash Cond": "(o.product_id = p.id)",


                    18
                          "Plans": [


                    19
                            {


                    20
                              "Node Type": "Seq Scan",


                    21
                              "Parent Relationship": "Outer",


                    22
                              "Parallel Aware": false,


                    23
                              "Async Capable": false,


                    24
                              "Relation Name": "orders",


                    25
                              "Alias": "o",


                    26
                              "Startup Cost": 0.00,


                    27
                              "Total Cost": 25.70,


                    28
                              "Plan Rows": 1570,


                    29
                              "Plan Width": 24,


                    30
                              "Actual Startup Time": 0.034,


                    31
                              "Actual Total Time": 0.035,


                    32
                              "Actual Rows": 5,


                    33
                              "Actual Loops": 1


                    34
                            },


                    35
                            {


                    36
                              "Node Type": "Hash",


                    37
                              "Parent Relationship": "Inner",


                    38
                              "Parallel Aware": false,


                    39
                              "Async Capable": false,


                    40
                              "Startup Cost": 1.01,


                    41
                              "Total Cost": 1.01,


                    42
                              "Plan Rows": 1,


                    43
                              "Plan Width": 202,


                    44
                              "Actual Startup Time": 0.022,


                    45
                              "Actual Total Time": 0.023,


                    46
                              "Actual Rows": 5,


                    47
                              "Actual Loops": 1,


                    48
                              "Hash Buckets": 1024,


                    49
                              "Original Hash Buckets": 1024,


                    50
                              "Hash Batches": 1,


                    51
                              "Original Hash Batches": 1,


                    52
                              "Peak Memory Usage": 9,


                    53
                              "Plans": [


                    54
                                {


                    55
                                  "Node Type": "Seq Scan",


                    56
                                  "Parent Relationship": "Outer",


                    57
                                  "Parallel Aware": false,


                    58
                                  "Async Capable": false,


                    59
                                  "Relation Name": "products",


                    60
                                  "Alias": "p",


                    61
                                  "Startup Cost": 0.00,


                    62
                                  "Total Cost": 1.01,


                    63
                                  "Plan Rows": 1,


                    64
                                  "Plan Width": 202,


                    65
                                  "Actual Startup Time": 0.015,


                    66
                                  "Actual Total Time": 0.017,


                    67
                                  "Actual Rows": 5,


                    68
                                  "Actual Loops": 1


                    69
                                }


                    70
                              ]


                    71
                            }


                    72
                          ]


                    73
                        },


                    74
                        "Planning Time": 0.315,


                    75
                        "Triggers": [


                    76
                        ],


                    77
                        "Execution Time": 0.131


                    78
                      }


                    79
                    ]
Explain Plan in DbVisualizer
Interpreting an EXPLAIN SQL plan can be challenging due to the dense information presented in a few lines of text. This is where DbVisualizer comes in!
As a comprehensive, powerful, and visual database client, DbVisualizer includes an advanced execution mode called Explain Plan. This feature offers a clear analysis of how a query will be processed by the database, supporting graph, tree, text, and grid formats, with node cost coloring.
Let's see Explain Plan in action within DbVisualizer!
In the following example, we will use a MySQL query, but the Explain Plan feature is also available in various other databases like Azure SQL Database, PostgreSQL, Oracle, and many others. For detailed information, check out the docs.
Execute the Query with Explain Plan: Write your SQL query and click on the "Execute the statement(s) as explain plan" button.

Launching a query in Explain Plan mode in DbVisualizer

The result will be the following graph:

As you can see, this format is significantly more readable compared to the standard output of the MySQL EXPLAIN command. The color-coded boxes help quickly identify resource-intensive operations, directing your attention to areas that require optimization. Additionally, the flow graph simplifies understanding of the database execution plan.
Similarly, you can explore the same database query plan in an easy-to-explore tree structure:

The same information can also be exported directly to an Excel file from DbVisualizer. Keep in mind that the types of available views for the execution query plan vary depending on the database.
Note: The Explain Plan feature is only available on DbVisualizer Pro.
Best Practices
Below is a list of some of the most important aspects to keep in mind when dealing with EXPLAIN in various database management systems:
Conclusion
In this article, you learned about the EXPLAIN SQL command, its support across databases like MySQL and PostgreSQL, and how it helps retrieve the query execution plan. You understood that studying query plans is essential for optimizing queries to enhance resource usage and overall performance.
Unfortunately, default EXPLAIN query plan outputs can be complex to read. Fortunately, that becomes easier with the DbVisualizer’s Explain Plan feature. By representing query plans in graph, tree, and other formats, you can easily identify areas for query optimization. This is just one of the many powerful features DbVisualizer offers, including support for numerous databases and ERD-like schema generation. Try DbVisualizer for free today!
FAQ
What databases support the EXPLAIN SQL statement?
The EXPLAIN SQL statement is supported by popular relational database management systems like MySQL, PostgreSQL, Oracle, and SQLite. As it is not part of the ANSI SQL standard, each database system has variations in syntax and additional options for EXPLAIN, tailored to their specific query optimization strategies.
What is the difference between EXPLAIN and EXPLAIN ANALYZE in MySQL?
EXPLAIN returns information about the execution plan for a given SQL query. It shows how the database engine intends to execute it, without actually launching it. Instead, EXPLAIN ANALYZE does execute the query and provides the execution plan along with actual run-time statistics.
What information does an SQL EXPLAIN plan contain?
The information contained in an SQL EXPLAIN plan changes from database to database. Nevertheless, it generally includes information on the sequence of operations, such as table scans, index usage, join methods, and sort operations. It may also show the estimated cost, number of rows processed, and access methods for each step.
How to explain JOIN in SQL?
To explain a JOIN in SQL, simply pass your JOIN query to the EXPLAIN statement. Given how slow and complex JOIN queries can become, th helps gain insights into how the database executes the query and whether it uses the defined indexes.
How to understand EXPLAIN ANALYZE SQL query plans?
Consider that your EXPLAIN SQL query plan with the ANALYZE option is:
                    1
                    -> Nested loop left join  (cost=6.85 rows=38)


                    2
                     -> Sort: o.amount  (cost=3.05 rows=38)


                    3
                      -> Table scan on O  (cost=3.05 rows=38)


                    4
                     -> Single-row covering index lookup on P using PRIMARY (id=o.product_id)  (cost=0.26 rows=1)
Now, let’s break it down row by row:
What is the SQL Server equivalent to MySQL's EXPLAIN?
While there is not a direct equivalent of the MySQL EXPLAIN statement in SQL Server, you can achieve something similar through the SHOWPLAN_ALL setting. When launching the SET SHOWPLAN_ALL ON query, SQL Server starts to return execution information for each statement without actually executing it.