intro
As businesses grow, managing and analyzing data becomes challenging. Traditional data warehouses have become expensive to scale and can no longer handle large data sets.
Fortunately, Google BigQuery solves these problems as a cloud-based data warehouse. It is designed to handle large sets of data fast by using a serverless architecture. With Google BigQuery, you don’t have to worry about managing servers or resources.
In this guide, you will learn what Google BigQuery is, why should you use it, and how to get started. Also, you will learn how to add data into Google BigQuery and how to query the data.
What is Google BigQuery?
Google BigQuery is a serverless data warehouse provided by Google Cloud. Google BigQuery enables businesses to store, query, and analyze large volumes of data efficiently and quickly.
The design of Google BigQuery enables it to handle petabyte-scale datasets by utilizing a distributed architecture to manage complex analytical workloads. In Google BigQuery, businesses can derive valuable insights from their data and make data-driven decisions.
Uses of Google BigQuery and Why to use it
Google BigQuery helps you manage and analyze your data with built-in features like machine learning, geospatial analysis, and business intelligence. Some use cases for Google BigQuery include:
Here are some reasons you should use Google BigQuery:
Getting Started with Google BigQuery
Getting started with Google BigQuery is user-friendly because it is a cloud service, and you don’t have to install any software. To get started with Google BigQuery, follow the steps below.
Step 1: To get started with Google BigQuery, navigate to Google Cloud Platform and click the console button on the top right side of the page.

Step 2: Complete the steps that follow, and you will be redirected to create a project by clicking the Create Project button.
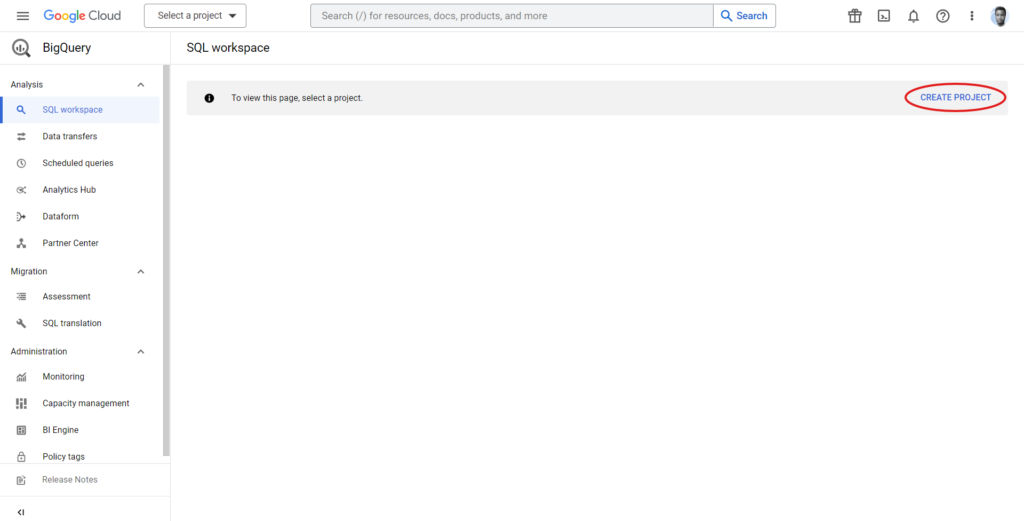
Step 3: Next, give your project a name and click the create button to create your project.

Step 4: After that, create a BigQuery dataset by opening the hamburger menu beside your project and clicking the Create dataset button.

Step 5: You will then be prompted to add a dataset id and select a data location. After that, click the Create Dataset button.
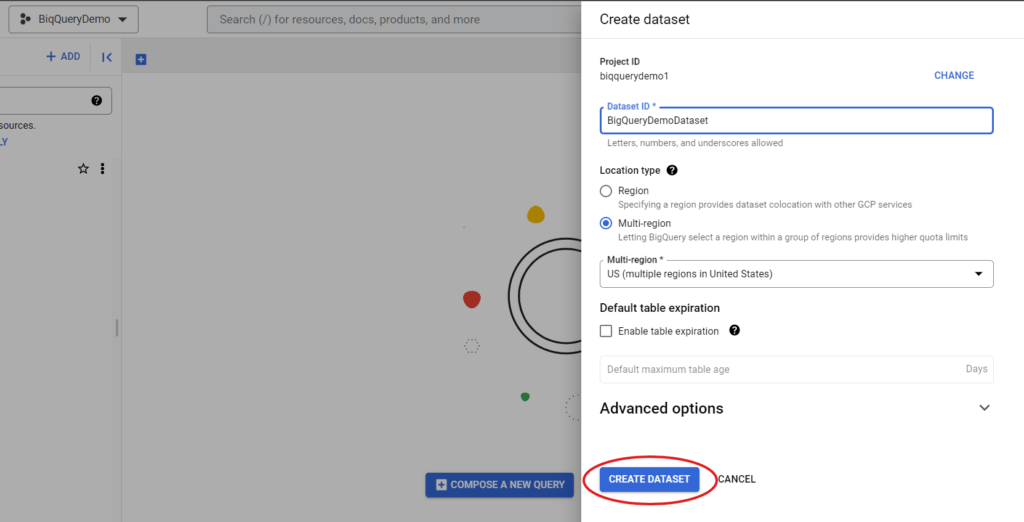
A new dataset is created in your project and you can click it to open it.
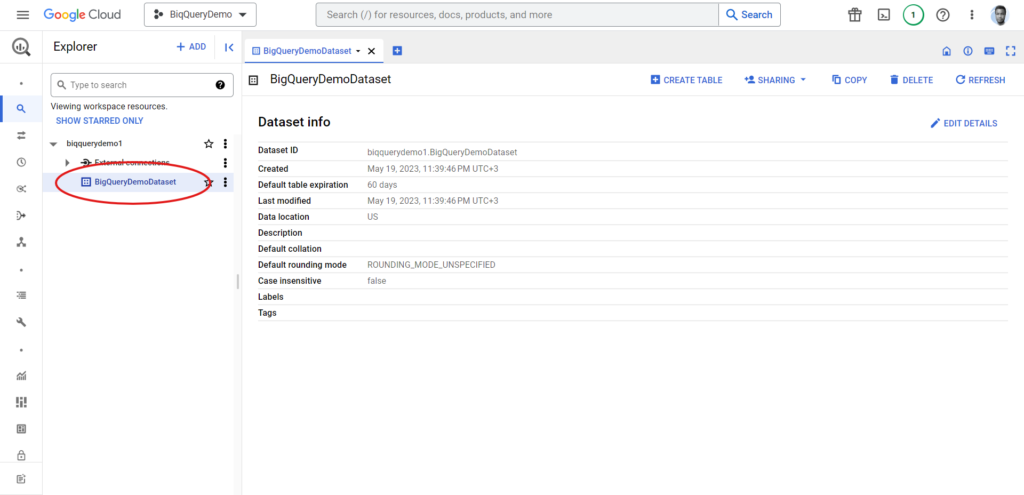
Adding data into Google BigQuery
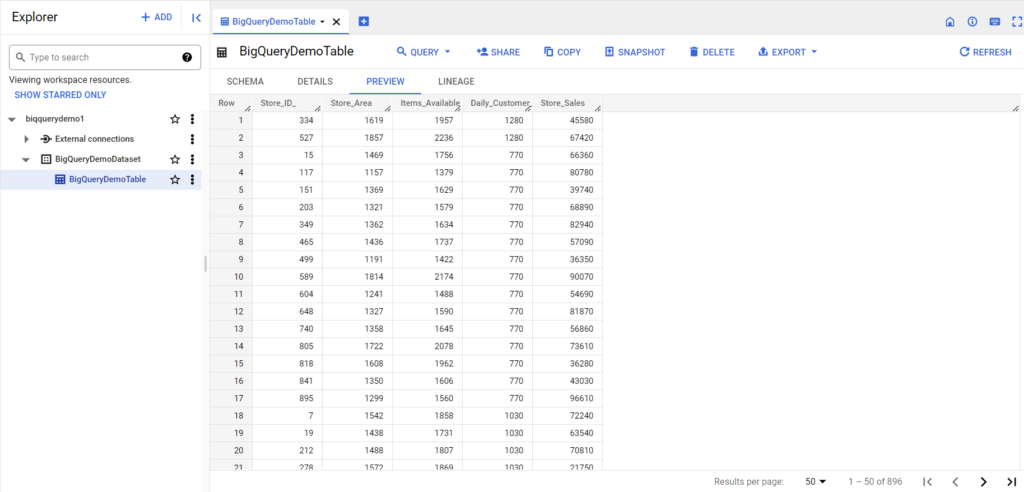
Let us add a supermarkets' stores dataset CSV file as the data source into Google BigQuery. You can download it by navigating to this Kaggle web page.
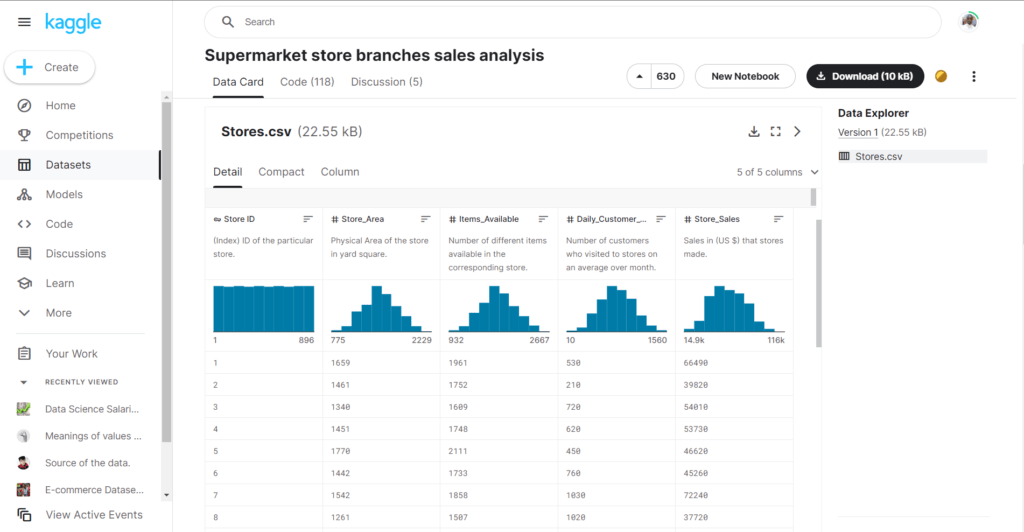
To add data into Google BigQuery, follow the steps below.
Step 1: On the Google Cloud Platform, open the dataset you created earlier and click the Create Table button.
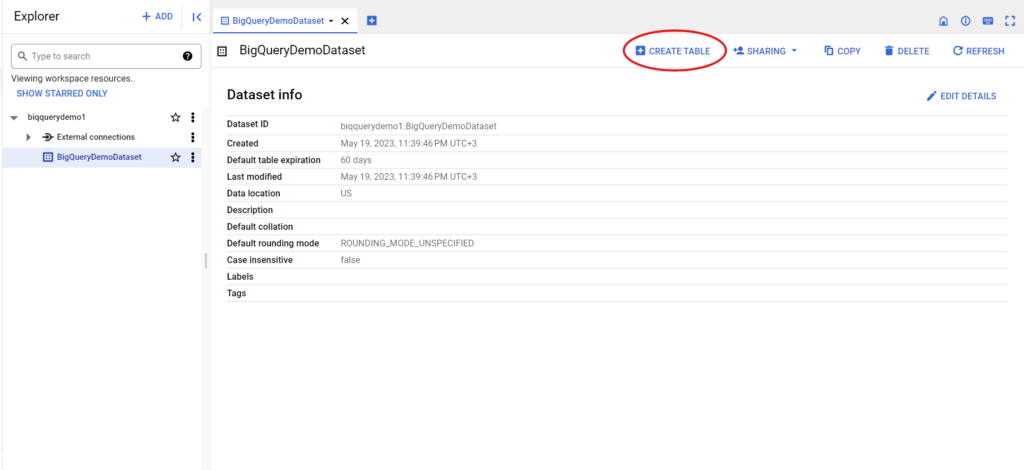
Step 2: After that, you will be prompted to add a data source. In the Create Table From field, select the Upload option.

Step 3: Next, click the Browse button, and navigate to where the supermarkets’ stores dataset CSV file was saved, and select it.

Step 4: Give the table data a name in the destination section.

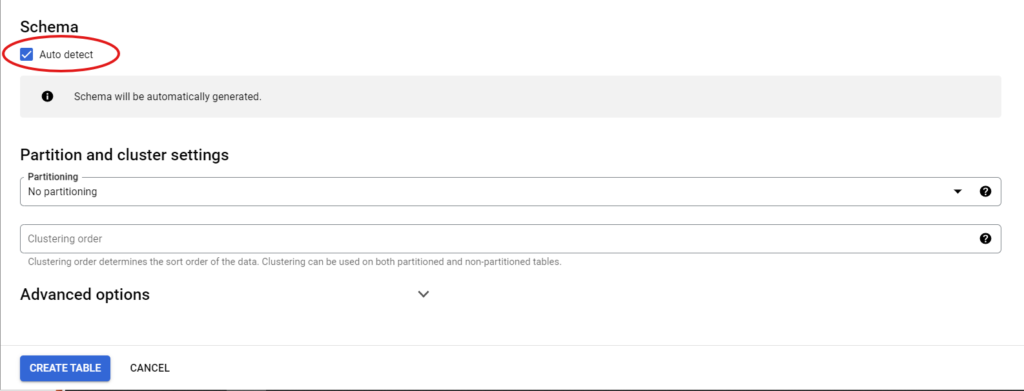
Step 5: After that, check the Auto detect checkbox to generate schema automatically once the table is created. Then click the Create Table button to create the table.
Once the table is created, you can view the supermarkets’ stores data under the preview tab.
Next, we need to query and visualize data in Google BigQuery using DbVisualizer, a database SQL client.
Connecting Google BigQuery With DbVisualizer
DbVisualizer is a universal database tool that provides a user-friendly interface for working with different database management systems (DBMS). It includes everything you need to develop, connect and manage your BigQuery database. It supports BigQuery-specific object types and everything else that makes BigQuery great.
To install DbVisualizer, navigate to the DbVisualizer download page. Then download the recommended installer for your operating system. After that, execute the installer you downloaded and follow the instructions.
Follow the user guide here to learn how to get started with DbVisualizer. Once DbVisualizer is installed and running on your computer, follow the steps below to connect it with Google BigQuery.
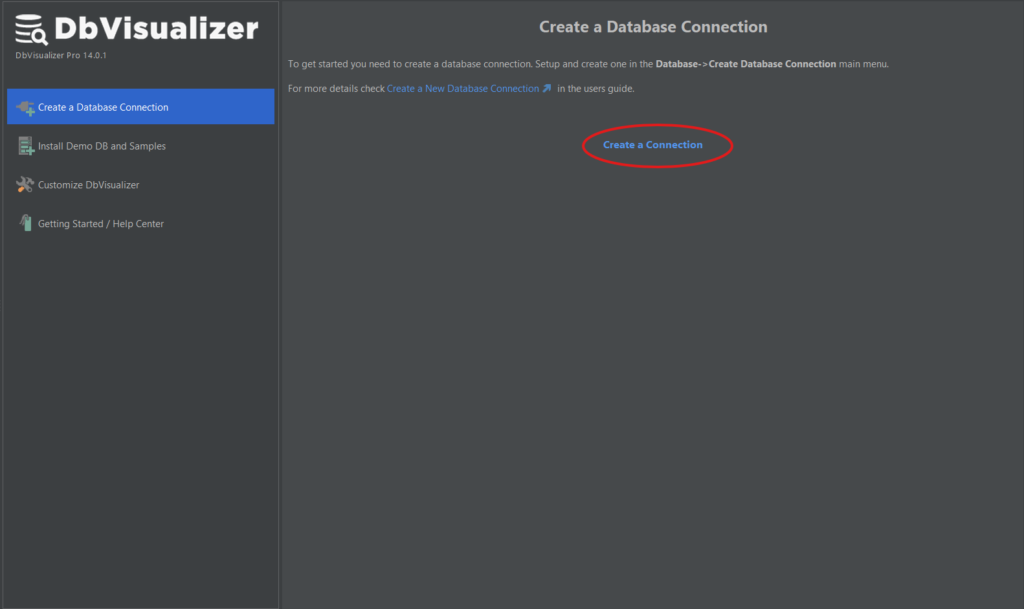
Step 1: On DbVisualizer, click Create a Connection button as shown below.
Step 2: Search and double-tap the Google BigQuery driver from the popup menu on the left side of your screen, as shown below.

An object view tab for the Google BigQuery connection is opened.
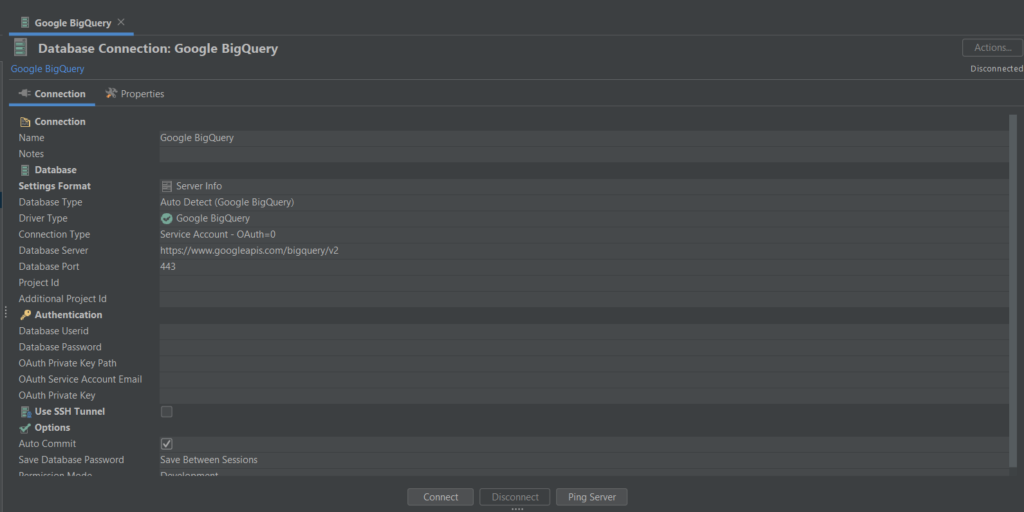
Step 3: In the connection tab, select Connection Type as OAuth 1.
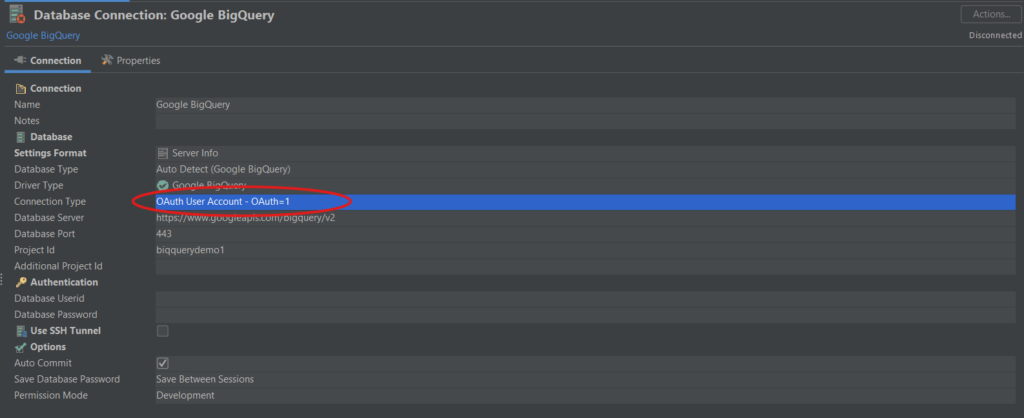
Step 4: Navigate back to Google BigQuery, get your project Id, and add it to the Project Id field on the connection tab.
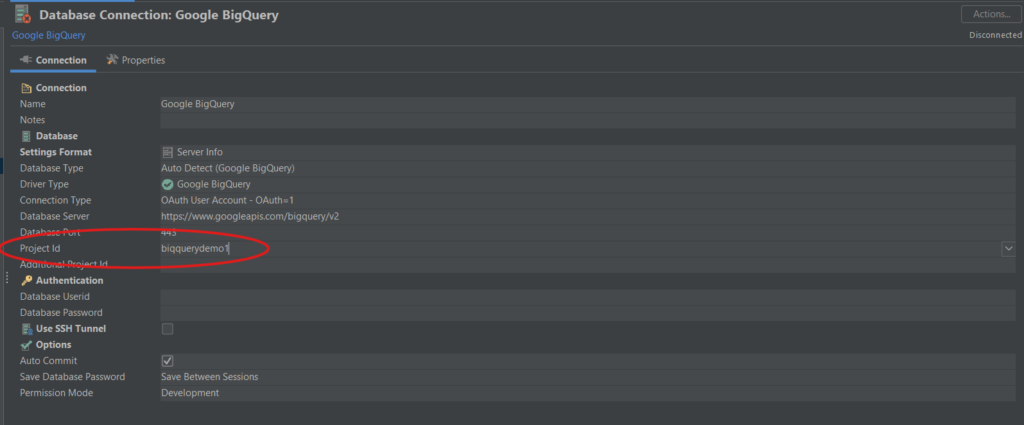
Step 5: Click the Connect button in the connection tab and the Google BigQuery driver will pop-up a dialog where you can obtain a URL.
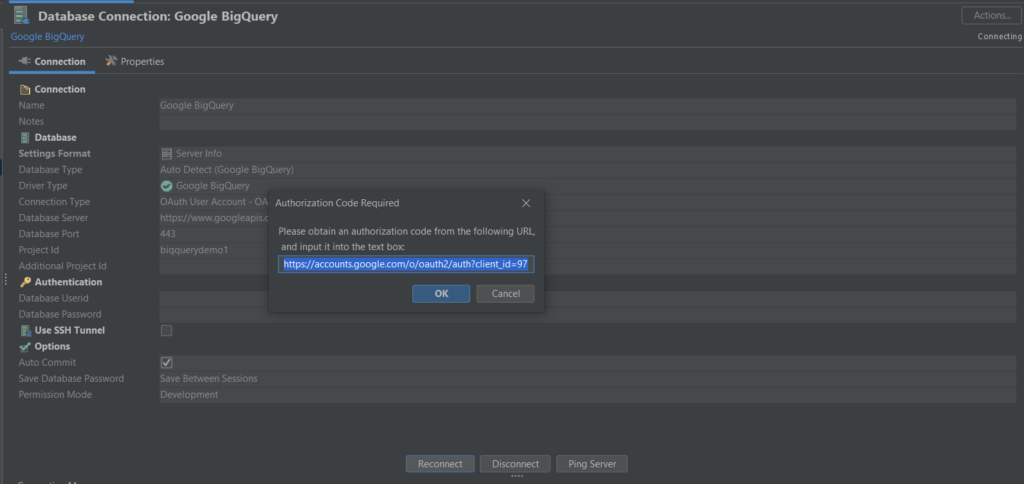
Step 6: Copy the URL into a browser and log in via Google. You will get a token string that you can paste into the same dialog where you copied the URL. After that, Click the OK button on the dialog to establish a connection.
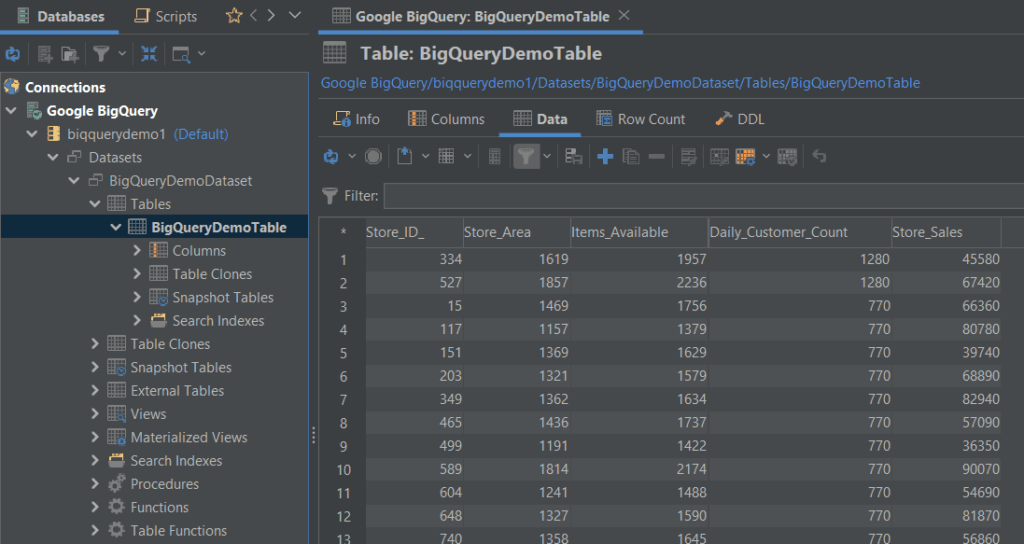
You’ve now established a connection between DbVisualizer and Google BigQuery!
Querying Data In Google BigQuery Using DbVisualizer
To run a query on data in Google BigQuery using DbVisualizer, follow the steps below.
Step 1: Press the (Ctrl+T) keys to open a SQL editor.
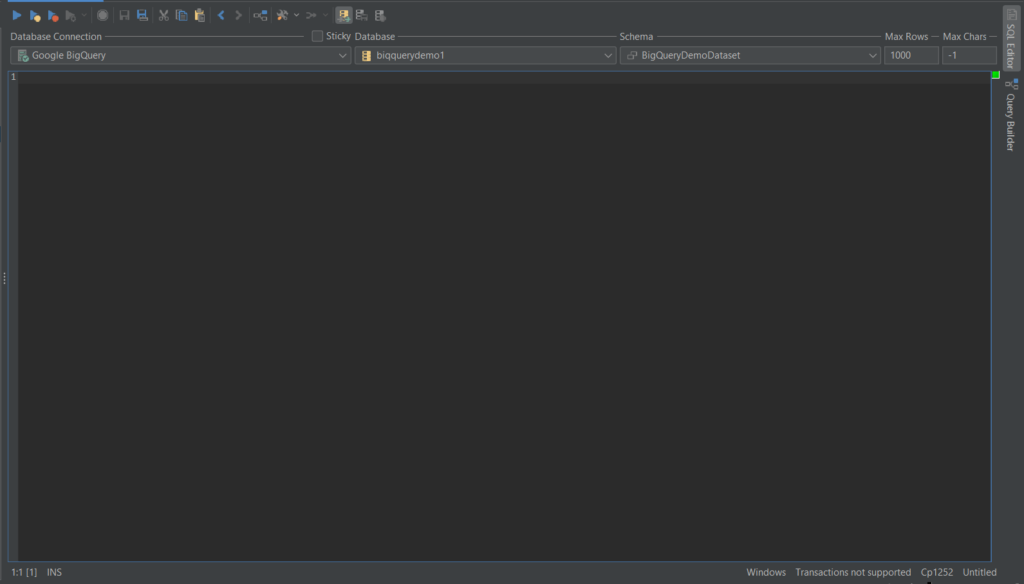
Step 2: Enter the SQL query below into the SQL editor and then press the (Ctrl+Enter) keys to run the query. The query determines the top 10 stores by sales from the stores' data on Google BigQuery.
                    1
                    SELECT BigQueryDemoTable.Store_ID_, BigQueryDemoTable.Store_Sales AS Sales


                    2
                    FROM biqquerydemo1.BigQueryDemoDataset.BigQueryDemoTable


                    3
                    GROUP BY BigQueryDemoTable.Store_ID_, BigQueryDemoTable.Store_Sales


                    4
                    ORDER BY BigQueryDemoTable.Store_Sales


                    5
                    DESC LIMIT 10
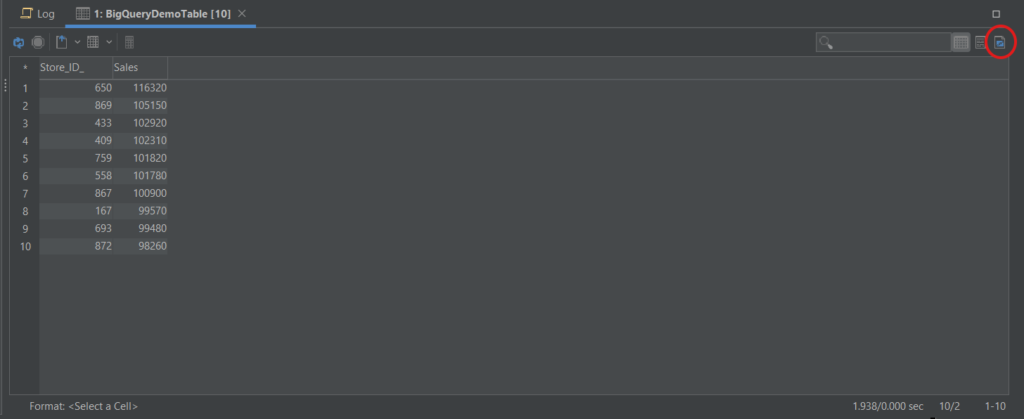
The SQL query results are shown in a table with two columns of Store_ID and Sales.

Visualizing Data In Google BigQuery Using DbVisualizer
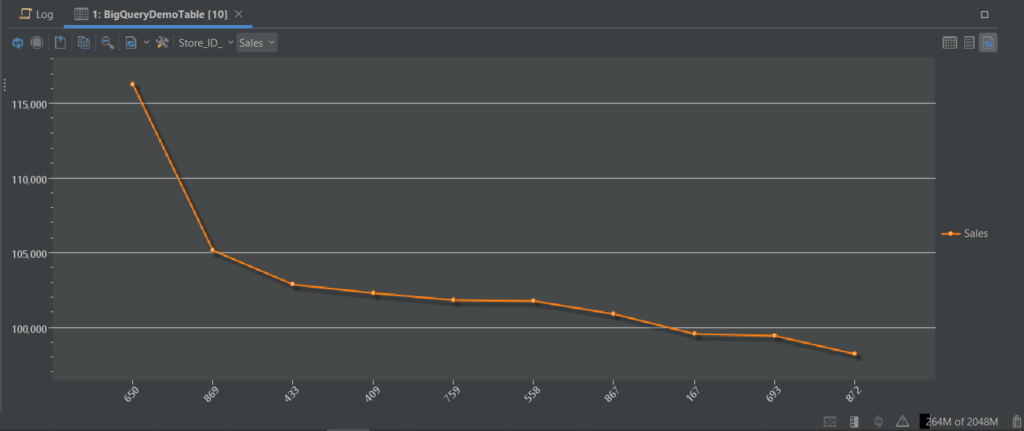
When using DbVisualizer, you can present data from any table in a configurable chart displayed in a line, bar, area, or pie chart. The charting support is similar to that of MsExcel. The charts can be exported as an image to file, printed, or copied to the system clipboard for easy sharing.
To activate the chart view, click the rightmost button in the result toolbar, as shown below.
In the chart, select Store_ID as the X-axis and Sales as the Y-axis, as shown below.
See how easy everything is? Why not try DbVisualizer today?
Conclusion
In conclusion, Google BigQuery is a powerful and efficient cloud-based data warehouse provided by Google Cloud to offer a scalable and cost-effective solution for businesses to store, query, and analyze large volumes of data.
Google BigQuery can also work in conjunction with multiple types of software solutions like SQL clients, and SQL clients like DbVisualizer can help query and visualize the data existing in the service.
We hope that you’ve found this blog useful - make sure to follow our blog for updates and news in the database space until next time.


