intro
Learn how to connect Postgres to DbVisualizer, import inventory dataset into Postgres, run SQL queries on Business Inventory data stored in a Postgres database using DbVisualizer to get important analytics and convert them to charts for visualization.
The function of every business is to create products and sell them to customers. The goods produced make up the inventory of the business. When the business is small, ensuring that the goods produced are sold is not a headache.
However, keeping up with the inventory as the business grows might become daunting. To streamline the production process, you might need to employ inventory management.
In this article, you will learn how to use SQL to manage business inventory data held in a Postgres database to come up with meaningful analytics. You will then learn how to convert the analytics into charts for visualisation.
What is Inventory Management?
Inventory management is the process of ordering, storing and selling a business’s inventory where inventory is one of the most valuable assets of a company. Employing inventory management will help the business minimise overstocking and improve the efficiency of the production process.
Some inventory management benefits include,
Prerequisites
To follow through with this tutorial, you need a database, an inventory dataset and a SQL client. In this case, we will use Postgres as the database, the Kaggle inventory dataset, and DbVisualizer as the database SQL client.
First, we will connect Postgres to DbVisualizer. Next, we will import the inventory dataset into Postgres using DbVisualizer. Then we will run SQL queries using DbVisualizer on the dataset to come up with important analytics. Finally, we will use DbVisualizer to create charts from the dataset.
What is Postgres and DbVisualizer?
PostgreSQL, also known as Postgres, is a free and open-source relational database management system. Postgres is available for Windows, macOS and Linux.
DbVisualizer is a SQL client or a database management and analysis tool for all major databases. The SQL client provides SQL tools such as SQL editor with support for auto-completion, parameterized SQLs, SQL formatter, visual query builder, command-line based interface and more.
Installing Postgres
To install Postgres, navigate to the Postgres download page and download it for your operating system. You can follow this guide to install Postgres on Windows, this guide to install on Linux and this guide to install on macOS.
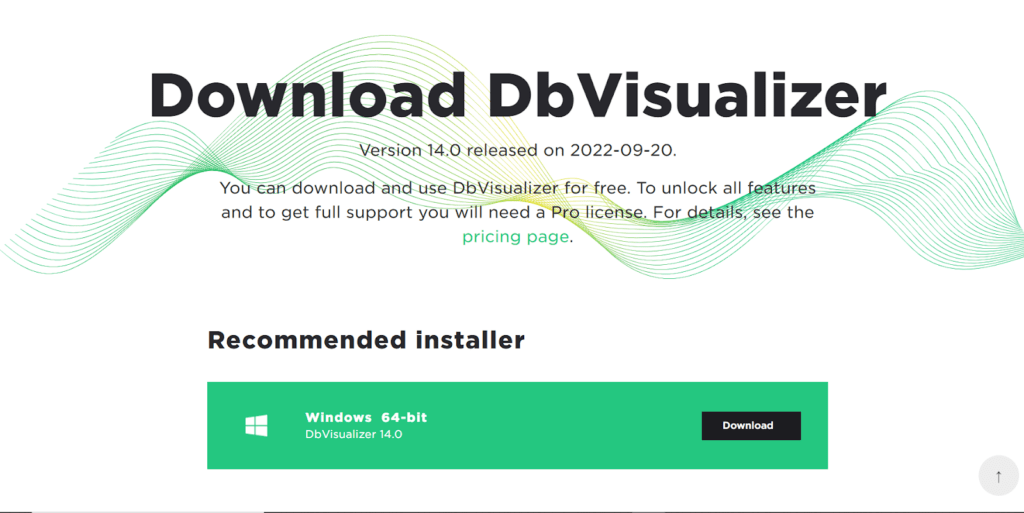
Installing DbVisualizer
To install DbVisualizer, navigate to the DbVisualizer download page. Then download the recommended installer for your operating system, as shown below.
After that, execute the installer you have downloaded and follow the instructions that follow. When you start DbVisualizer, you are prompted to choose the DbVisualizer plan to proceed. You can proceed with the DbVisualizer free version with limited features or get a a 21-day free trial.
Connecting Postgres To DbVisualizer
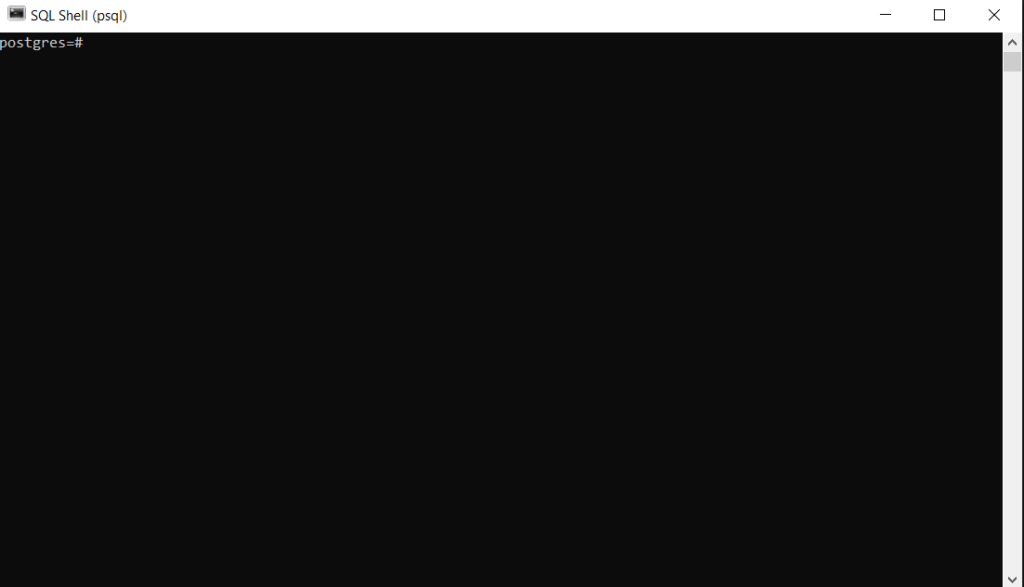
Step 1: Open Postgres using the command line or SQL shell as shown below.
Step 2: Create a database called inventory in Postgres by running the command below on the command line.
                    $
                    create database inventory;
You can check if the database has been created by typing forward slash together with L and hitting enter. After that, you should see the inventory database we created on the list of databases in Postgres, as shown below.

Step 3: Start DbVisualizer and click create a connection button as shown below.

Step 4: Search and select Postgres driver from the popup menu on the left side of your screen, as shown below.

An object view tab for the Postgres connection is opened.
Step 5: Fill in the empty fields as shown below
Name:InventoryManagement
Database: inventory
Database Userid: postgres
Database Password: Enter Your Postgres password
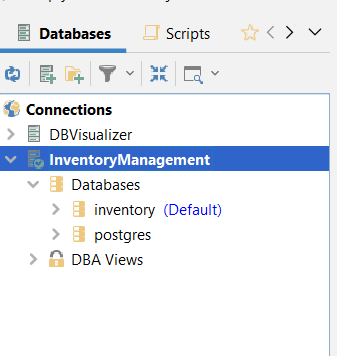
Once you have filled all the empty fields, click the connect button at the bottom. If the connection is succesful, your screen should look as shown below.

Importing Data Table Into Postgres Using DbVisualizer
Step 1: Navigate to this Kaggle web page and download the inventory dataset.

Step 2: Next, Open the database connection Inventory Management tab tree as shown below.

Inside the connection tab tree, open the Databases tab tree.
Inside the Databases tab tree, open the inventory database tab tree.

Inside the inventory database tab tree, open the schemas tab tree.
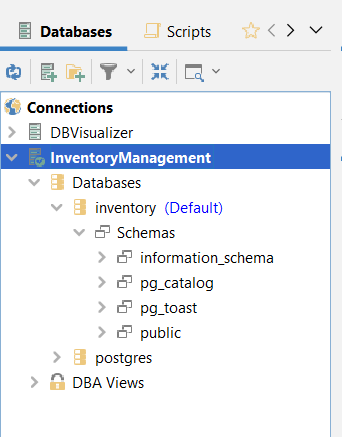
Inside the schemas tab tree, open the public tab tree.

Step 3: Right-click on the Tables tab tree and select Import Table Data.

Step 4: When you reach the popup window, navigate to the directory you downloaded the inventory dataset CSV file into and click the Open button.

Step 5: Keep clicking the Next button below the popup window until you reach the window shown below.

The first thing to do on this popup window is to give the table that will hold the inventory dataset a name. In this case, I have named my table InventoryData as shown below.
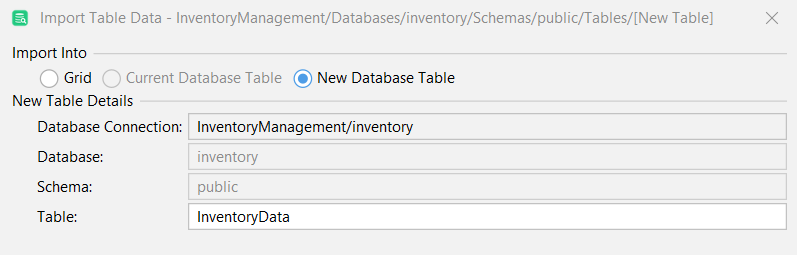
The second thing to do is change all bit data types to boolean data types by clicking the data type as shown below. This is because the database table accepts boolean data types instead of bit data types.

Next check the Use Delimited Identifiers checkbox as shown below. This is because in our dataset we have a column called Order. Order is a reserved word in Postgres and checking Use Delimited Identifiers will help Postgres to differentiate column name order from the reserved name Order.

Click next and then import the dataset into Postgres. Once the dataset is imported, right-click on the table tab and refresh to see the table data as shown below.

Open the table and navigate to the Data tab. You should be able to see the dataset imported, as shown below.

Running SQL Queries
The dataset contains historical sales data identified with the column titled File_Type together with current active inventory that needs evaluation. The historical data shows sales for the past 6 months.
The SoldFlag column shows products that have been sold in the last 6 months as true and those that have not sold in that period as false. The SKU_number column has the unique identifier for each product, while the PriceReg column has the price of each product.
As a data analyst, you can come up with stats from the dataset, such as the following:
Sales revenue each product made in the last 6 months.
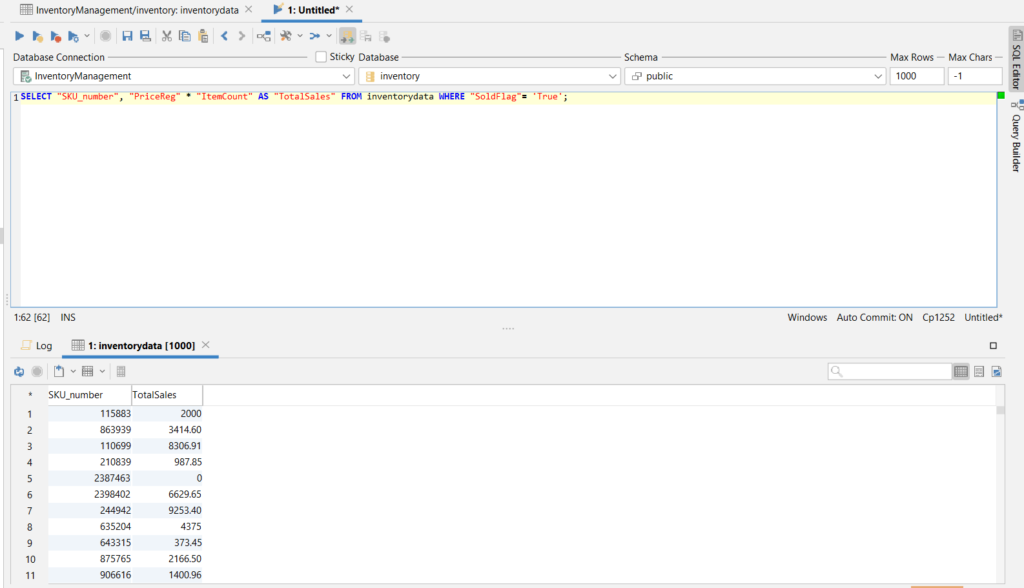
To get sales revenue each product made in the last months, create a SQL query that multiplies the PriceReg column with the ItemCount column where the SoldFlag column is true.
The SQL query you can create to get the TotalSales of the products sold in the last 6 months should look as shown below.
                    1
                    SELECT "SKU_number", "PriceReg" * "ItemCount" AS “TotalSales”


                    2
                    FROM inventorydata WHERE "SoldFlag"= 'True';
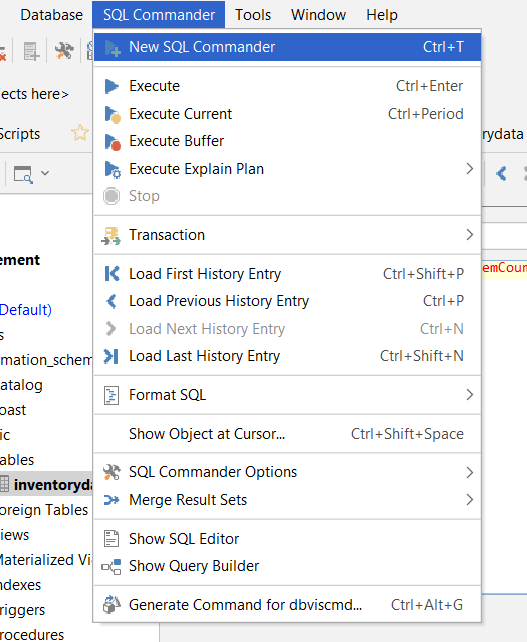
To run the SQL query on DbVisualizer, click the SQL Commander tab at the top of your screen and select New SQL Commander as shown below.
Once the SQL Commander opens, type the SQL query and press the (Ctrl+Enter) keys to run the query. You should now see a new table with columns SKU_number and TotalSales, as shown below.
Products not sold in the last 6 months?
To get the number of products that were not sold in the last 6 months, create a SQL query that counts the SKU_number column where the SoldFlag column is false.
The SQL query should look as shown below.
                    1
                    SELECT COUNT("SKU_number") FROM inventorydata WHERE "SoldFlag"='False';
Run the SQL query on DbVisualizer using (Ctrl+Enter) keys, and you should see that 63000 products were not sold in the last 6 months as shown below.

Ten best selling products in the last 6 months.
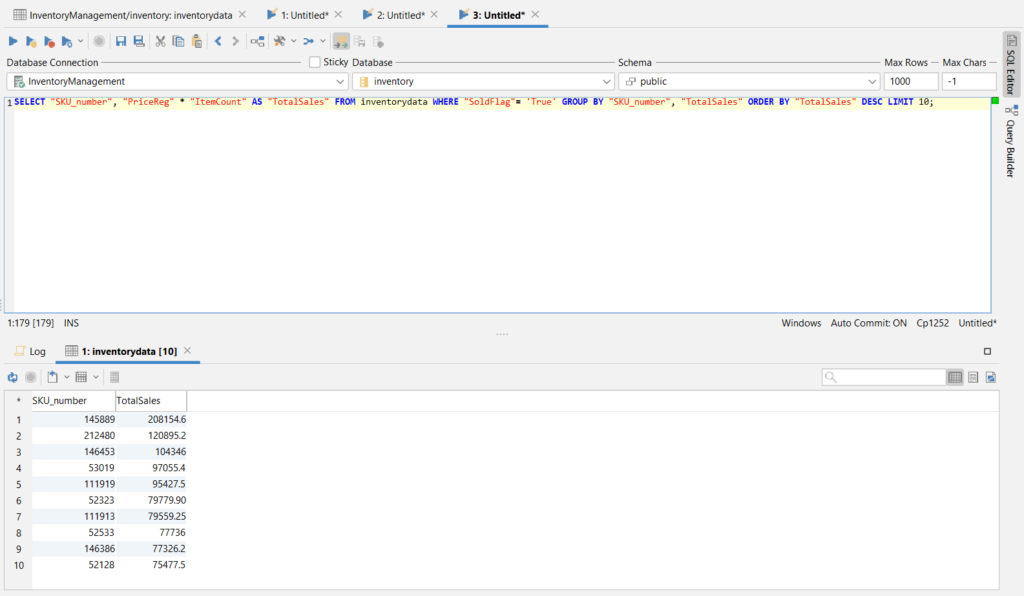
To get the top 10 selling products in the last 6 months, create a SQL query that finds products' total sales in the last 6 months. Next, build a SQL query that groups the total sales by columns SKU_number and TotalSales.
After that, the SQL query should order the sales by the TotalSales column, where they are limited to only the first 10 products in a descending order. The SQL query should look as shown below.
                    1
                    SELECT "SKU_number", "PriceReg" * "ItemCount" AS "TotalSales"


                    2
                    FROM inventorydata WHERE "SoldFlag"= 'True'


                    3
                    GROUP BY "SKU_number", "TotalSales"


                    4
                    ORDER BY "TotalSales"


                    5
                    DESC LIMIT 10;
Run the SQL query on DbVisualizer using (Ctrl+Enter) keys and you should see a table of top 10 selling products in the last 6 months as shown below.
Visualizing Data Using Charts on DbVisualizer
On DbVisualizer, you can present data from any table in a configurable chart displayed in a line, bar, area or pie chart. The charting support is similar to that of MsExcel. The charts can be exported as an image to file, printed and copied to the system clipboard for easy sharing.
To activate the chart view, click the rightmost button in the result toolbar as shown below.

When switching to the chart view, DbVisualizer automatically picks the first date or text column as the X-axis for the chart and the first numeric column as the Y-axis. In the following example, the SKU_number is the X-axis and TotalSales as Y-axis as shown below.

Visualizing Top 10 Selling Products
First, Activate the chart view on the best selling products.

Once that’s done, you should see a chart where SKU_number is on X-axis and TotalSales on Y-axis as shown below.

Conclusion
In this article, we have walked you through PostgreSQL and DbVisualizer while helping you to work with a data set related to the inventory of a business. Doing so can help you to come up with exciting insights that can help the business management to make the right decisions that can lead to its growth.
I challenge you to create different SQL queries and see what insights you can come up with using DbVisualizer - come back to our blog to learn what’s new on the database front after a while, and until next time!