intro
As a developer or database administrator, queries running slow is the last thing you want. When queries execute slowly, they can cause users of your application to wait too long for data to load, leading to a poor user experience and increased latency.
In addition, slow queries can make it challenging to scale your application because as your user base and database become more complex, processing large amounts of data leads to a high hardware and data storage cost to meet the demand.
To avoid all these issues caused by queries executing slowly, you can use explain plan to analyze how queries are being executed in a database. By analyzing how queries are being executed, you can discover causes of slow query execution which can help you improve query execution speed.
In this article, you will learn what is an explain plan and how to use it to understand how a query is executed in a PostgreSQL database. Moreover, you will learn how to optimize query execution to improve database performance.
Prerequisites
To follow through with this article, you need a database SQL client. In this case, we will use DbVisualizer. To install DbVisualizer, navigate to the DbVisualizer download page. Then download the recommended installer for your operating system. After that, execute the installer you downloaded and follow the instructions.
Follow the user guide here to learn how to get started with DbVisualizer.
What is an explain plan and EXPLAIN ANALYZE in PostgreSQL?
The explain plan and the EXPLAIN ANALYZE query are features in PostgreSQL used to analyze how a query is executed in a database. The explain plan shows estimated statistics of running a query, while EXPLAIN ANALYZE executes the query and shows actual statistics about its execution.
The explain plan provides information on the type of operations performed and the estimated cost of each operation. Explain analyze provides information such as the actual cost of executing a query.
The syntax for the explain plan command in PostgreSQL
An EXPLAIN statement is used as an explain plan command in PostgreSQL and many other database management systems. The EXPLAIN statement returns the execution plan the PostgreSQL planner generates for a given statement. Below is the syntax of the EXPLAIN statement.
                    1
                    EXPLAIN [ ( option [, ...] ) ] sql_statement;
In the syntax above, sql_statement represents the SQL query you want to analyze, while the option parameter allows you to specify various options for the output of the explain plan command. Some common options include:
Reading and Understanding the Output of EXPLAIN in PostgreSQL
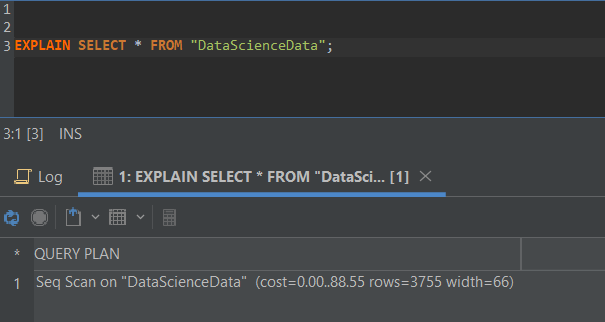
Here is an example of how to use the explain plan command to analyze a simple query. We use the DbVisualizer SQL client to make everything work smoothly:

When reading an output of explain plan command, first, you need to identify the operation type. An operation type can have a label of Seq Scan, as shown above. In this case, the Seq Scan operation type means that the database engine is scanning every row in the table sequentially to find the matching rows for the query.
Secondly, analyze the cost, which represents start-up and total costs. The start-up cost is an estimate of the cost of performing any initial work that needs to be done before the query execution can begin. The total cost is an estimate of the cost of processing the query. In this case, the start-up cost is 0.00, and the total cost is 88.55.
Then, analyze the output rows and width. Output rows are the estimated number of rows processed, while the width is the estimated size of each output row in bytes. In this case, the number of output rows is 3,755, and the width is 66 bytes.
Reading the Output of an EXPLAIN Plan Statement in PostgreSQL
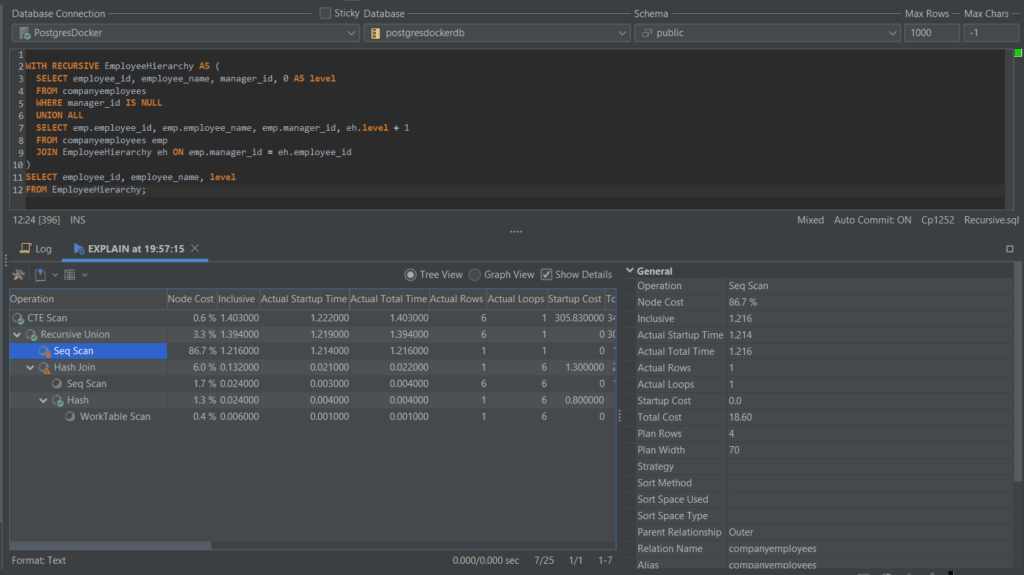
As you might have noticed, it is hard to read an explain plan command output because all the details, like the start-up and total costs, are not indicated. Using DbVisualizer, you can display the output results in graph view and tree view with an option to show all the details.
For example, consider the query below.
                    1
                    WITH RECURSIVE EmployeeHierarchy AS (


                    2
                        SELECT employee_id, employee_name, manager_id, 0 AS level


                    3
                        FROM companyemployees


                    4
                        WHERE manager_id IS NULL


                    5
                        UNION ALL


                    6
                        SELECT emp.employee_id, emp.employee_name, emp.manager_id, eh.level + 1


                    7
                        FROM companyemployees emp


                    8
                        JOIN EmployeeHierarchy eh ON emp.manager_id = eh.employee_id


                    9
                    )


                    10
                    SELECT employee_id, employee_name, level


                    11
                    FROM EmployeeHierarchy;
To analyze the query, click the button above the SQL editor, as shown below.

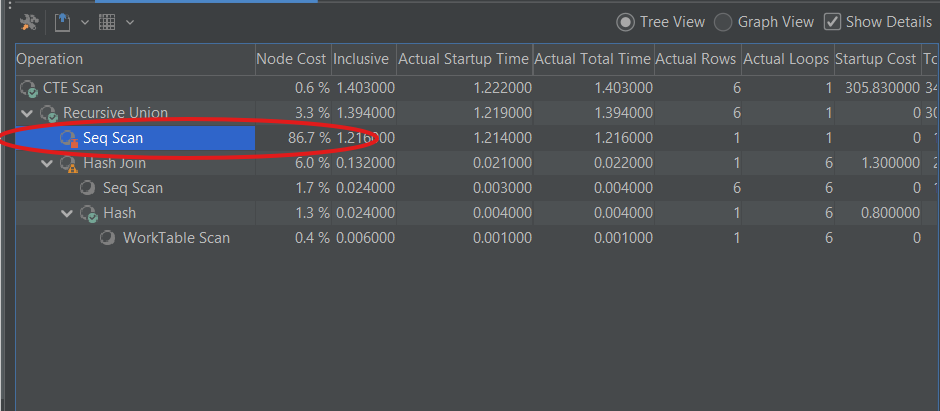
The output results will look as shown below in a tree view. The relative cost is indicated using colored adornment on each node. If you select a node such as Seq Scan, as shown below, you can see the details if the Show Details checkbox is checked.

If a node is colored green, it means the node cost is low, and no optimization is needed. For example, the CTE scan node is colored green since it has a node cost of 0.6%.

If a node is colored red, it means the node cost is high, and optimization is needed. For example, the Seq scan node is colored red since it has a node cost of 86.7%.

The explain plan output results will look as shown below in a Graph view. You can zoom in or out, choose detail levels, export it to an image file, or print it using the toolbar buttons. The relative cost is indicated by node color and If you click the output results card, you can see all the query execution details on the right.

Optimizing Database Query Execution in PostgreSQL
There are several ways to optimize database query execution in PostgreSQL. Here are some tips:
Conclusion
In summary, slow query execution can lead to a poor user experience, as well as application scalability problems. To avoid these issues, developers and database administrators can use an explain plan to analyze how queries are being executed in a PostgreSQL database, then optimize the queries to improve execution speed. We hope you’ve found this blog useful - make sure to follow our blog for updates and news in the database space and until next time.


