Sending Logs to Support
When you report a problem that you can repeat, debug logs help support find the cause. DbVisualizer writes its logs to the .dbvis/logs folder in your home directory, and you open them using Tools → Debug Window.
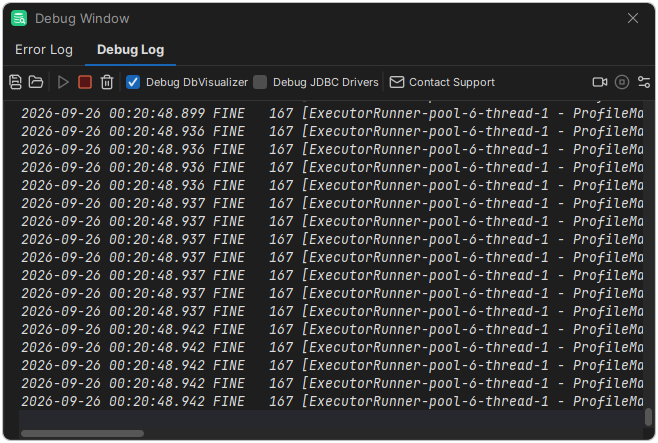
Collecting debug logs
- Select File → Clear Cache → Clear All, and click Clear.
- Restart DbVisualizer.
- Select Tools → Debug Window, and select Debug DbVisualizer. If support asks for logs from the database driver too, also select Debug JDBC Drivers. It writes a lot of entries, so only select it if you are asked to.
- Do what causes the problem.
- In the Debug Window, clear Debug DbVisualizer and Debug JDBC Drivers.
- Select Help → Contact Support. Describe step by step what you did, and if you are answering a support ticket, mention its number. Screenshots or a screen recording of the problem help a lot: drop the files on the form, or click Attach File.
- Check that Attach Logs is selected, and click Send.
Recording a performance problem
If DbVisualizer is slow or stops responding, a recording shows support what it is doing.
- Select Tools → Debug Window, and click Start Java Flight Recording.
- Do what is slow.
- Click Stop Java Flight Recording. DbVisualizer offers to open Contact Support with the recording attached.
If DbVisualizer is slow when it starts, click Configure Java Flight Recording instead. Set how long to record, and click Restart. DbVisualizer restarts and records the startup.
Finding errors
When an error is written to the log, a red icon is shown in the status bar. Click it to see the error in the Error Log tab of the Debug Window. To open the folder with the log files, click Open Logs Directory.