Handling Memory Constraints
If DbVisualizer gets close to its memory limit, for example because you have loaded a lot of data, it can become slow or stop responding, or show an error such as "java.lang.OutOfMemoryError: Java heap space".
The High Memory Usage Detected window
To prevent this, DbVisualizer keeps track of the memory it uses. When it is close to the limit, it pauses all background tasks that use memory and opens the High Memory Usage Detected window.
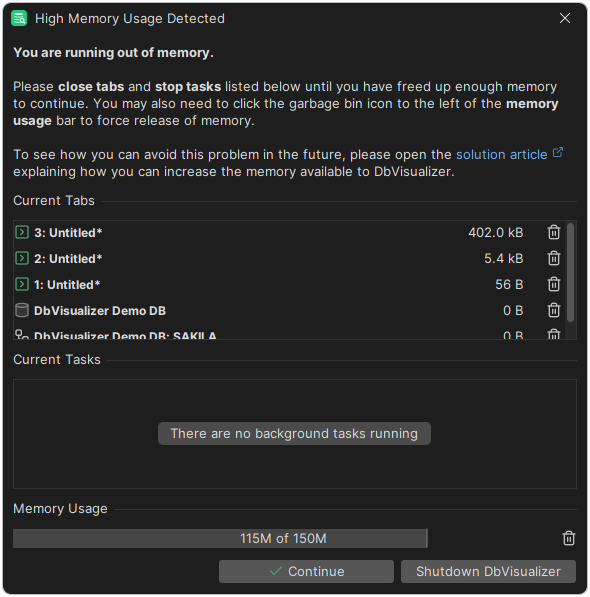
The window lists the open tabs, with an estimate of how much memory each one uses, and the background tasks. To free up memory:
- Click the trash icon next to the tabs that use the most memory to close them, and next to tasks to stop them.
- If the Memory Usage bar doesn't go down, click the trash icon next to it to release memory that is no longer used.
- When enough memory is free, the Continue button shows a green checkmark. Click it to continue working.
If you click Continue while the memory usage is still high, you are asked to confirm. If you can't free enough memory, click Shutdown DbVisualizer and start it again.
Using less memory
If the window opens often, try to use less memory:
- Close SQL Commander tabs that you don't need. Open tabs and their results usually use the most memory. Save scripts to files, and open them when you need them.
- Limit the number of rows in results with Max Rows.
- Run large scripts from a file using the
@runcommand. See Executing a Script File. - Write large results to a file using the
@exportcommand instead of showing them in a grid. See Exporting Results (@export).
Increasing the memory
If you still need more memory, you can increase the amount that DbVisualizer can use. See Increasing the memory.