Using the Map View
Only in DbVisualizer Pro
This feature is only available in the DbVisualizer Pro edition.
You can view a result set with geographic data on an interactive map. Each row is a feature on the map: a point, a line or a polygon. You can pan, zoom, color and label the features, and inspect the data of each one.
The map viewer is available as an alternative view for a result set, alongside the standard data grid. To open it, click the Map button in the result set toolbar, or right-click the result set and choose Show As → Map.
The map view is not available on Windows on Arm.
Here are two sample maps, one featuring points and the other polygons:
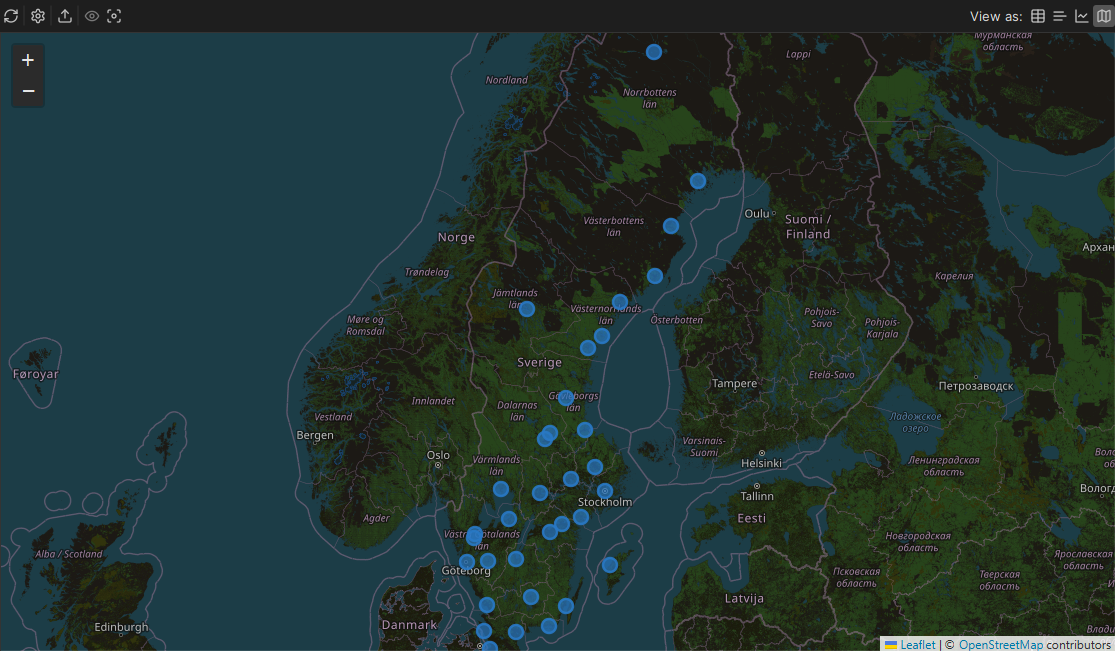
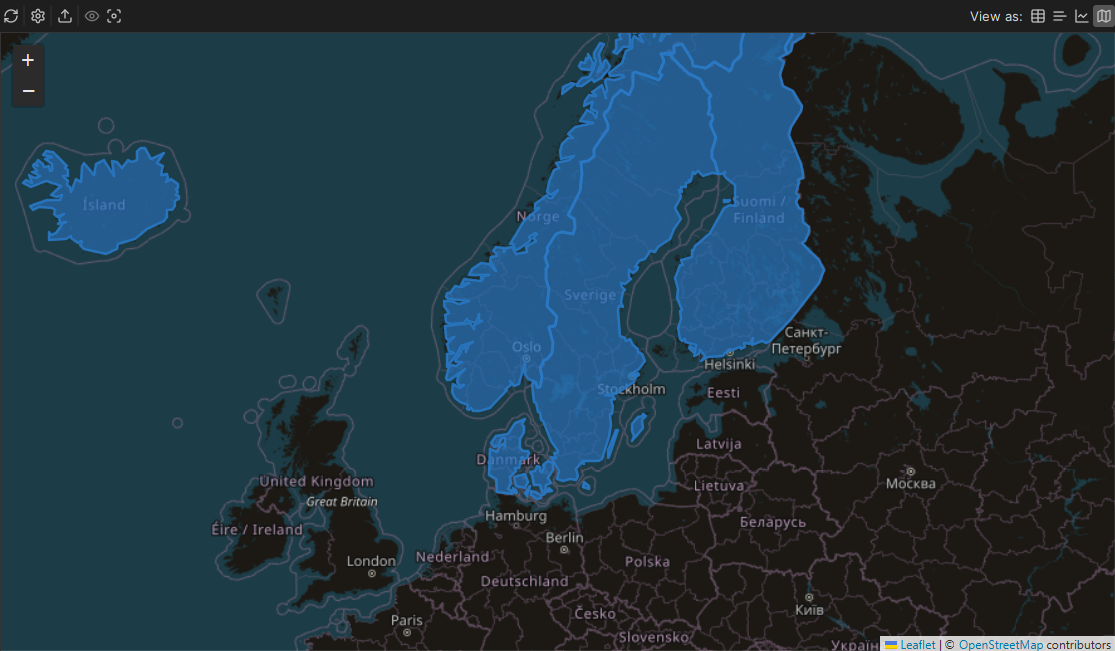
Showing a result set on the map
When you switch to the map view, DbVisualizer looks for columns with geographic data and plots them. How the columns are found and read depends on the database.
Native support: H2, PostgreSQL (PostGIS), MySQL, SQL Server, and Oracle are supported natively. Their geometry and geography columns - including native binary formats - are automatically recognized and decoded with no manual conversion required.
Best-effort support: Any other database engine is handled on a best-effort basis. Well-Known Text (WKT/EWKT) string formats (for example,
POINT(1 2)) are displayed for any database. Standard binary forms (EWKB hex and plain OGC WKB bytes) are also attempted, though proprietary or non-standard binary formats may not decode. Text columns aren't found automatically, so open the Settings panel and select the column. If a spatial column fails to render, return it as WKT using an OGC-standard function such asST_AsText()in your query, and select that column:SELECT id, name, ST_AsText(geom) AS location FROM places;Coordinate pairs: Latitude and longitude work with all databases when stored as two numeric columns. They are found automatically when their names contain
latandlonorlong; otherwise, select them in the Settings panel.
The map supports WGS 84 coordinates (SRID 4326) only. Rows that use another coordinate system, or have coordinates outside the valid range, are not drawn, and a notice tells you how many rows are shown.
Choosing what to show
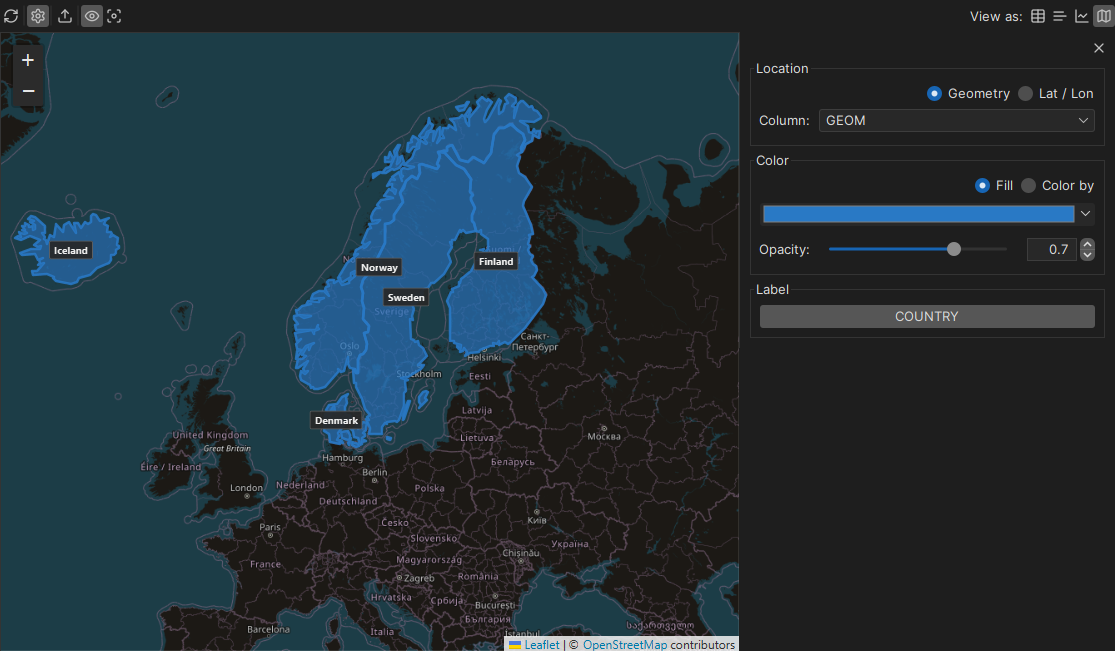
When a geometry column or a latitude/longitude column pair is detected, the Settings panel opens automatically with that column pre-selected. If no spatial data is automatically detected, you can open the panel manually by clicking the settings icon in the map toolbar.
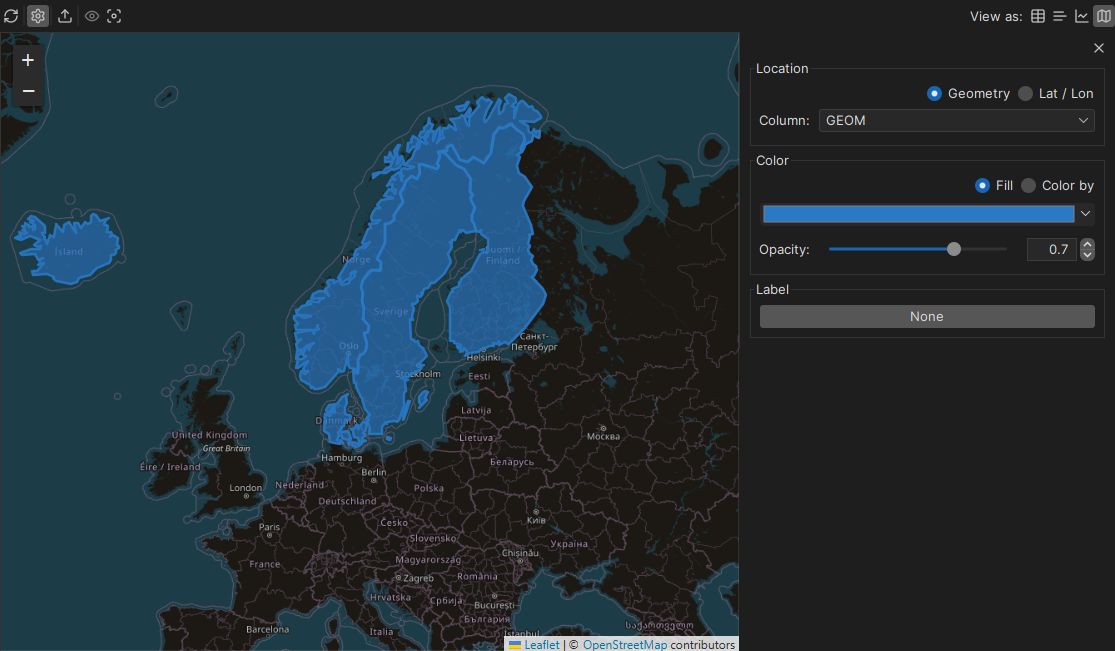
Location
Choose the source format of your geographic data.
- Geometry: Reads the location data from a single spatial column. Select your target column from the Column drop-down menu.
- Lat / Lon: Reads the location data from two numeric columns. Select the latitude and longitude columns from the drop-down menus.
Color
Customize how features are styled and distinguished on the map background.
- Fill: Draws every map feature in a single, uniform color chosen from the color picker.
- Color by: Colors each feature dynamically based on a specific column's value. After choosing the target column, select a Scale and a color palette, and specify the number of Steps (ranging from 2 to 20) to divide the color bands.
Use Opacity (0 = transparent, 1 = opaque) to set how much of the background map shows through the features.
Below is an example of a dataset colored dynamically by a specific column: 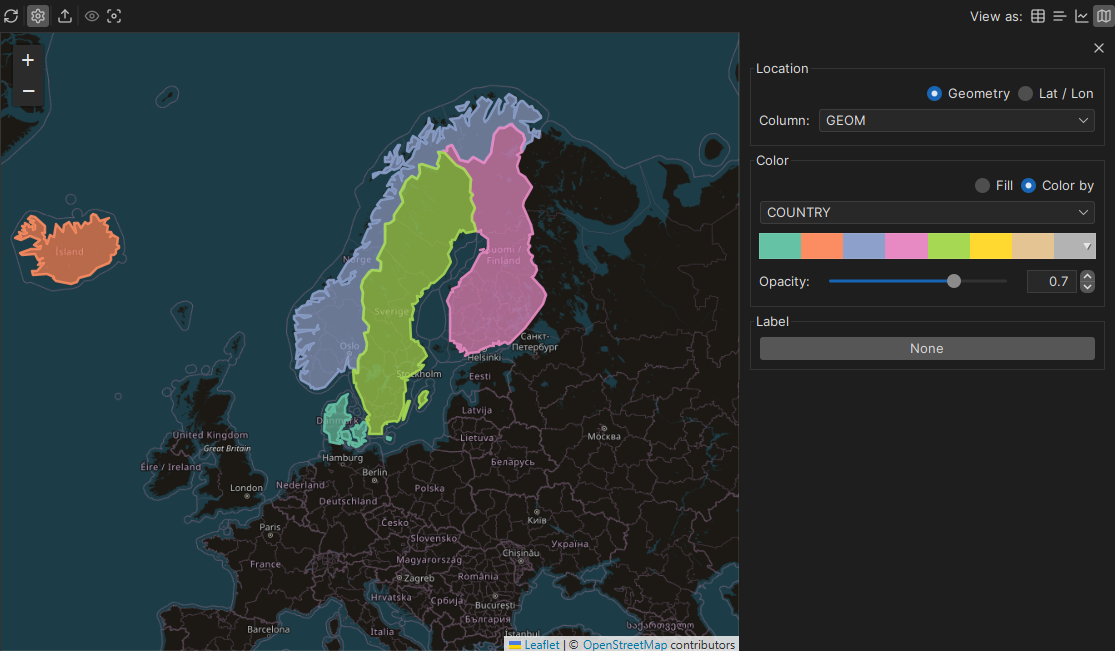
Label
Select one or more columns to label each mapped feature with its corresponding data value, or leave the setting at None for a clean map interface. Once your labels are configured, you can toggle their visibility on and off using the Show labels icon in the map toolbar.
Navigating the map
You move around the map as in other web maps:
- Pan: Click and drag anywhere on the map surface.
- Zoom: Use your mouse scroll wheel, double-click, or use the + and – buttons in the upper-left corner.
- Fit: Zooms and centers the map so all features are visible.
The map is centered on your data when it opens.
Inspecting a feature
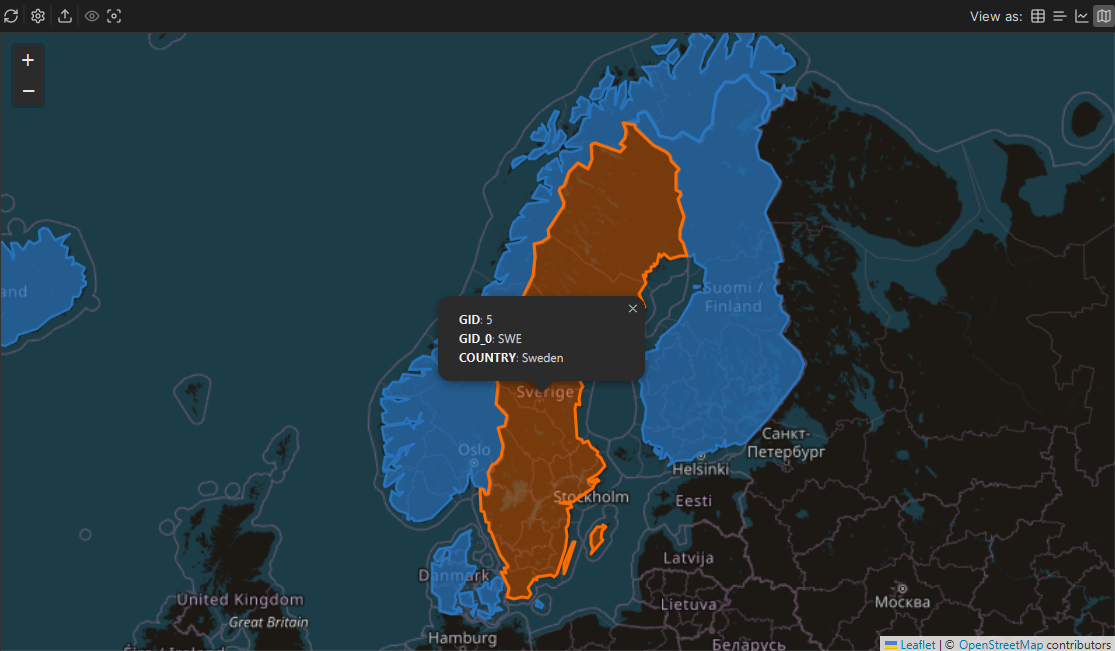
Click a feature to see the values of its row in a popup, without going back to the grid.
Exporting the map
To save the map as an image, click Export in the map toolbar. You can save it as PNG, GIF, RAW or TIFF. The image has the same area, zoom and styling as the map you see.
Trying it out with sample data
If you do not have geodata, you can ask the AI Assistant to generate a sample dataset for you.
First, ensure you have installed the demo database. Next, open the AI Assistant panel and submit the following prompt:
In my H2 DbVisualizer Demo database, create one table called 'geo_sample':

- 'id' integer primary key
- 'name' varchar
- 'category' varchar, using a few repeating values (e.g. city, river, road, lake, region)
- 'metric_value' integer, with varied numbers
- 'geom' as a native H2 'GEOMETRY' column

Insert 20 rows of real places in a country of your choice, mixing geometry types: mostly 'POINT's (cities), a few 'LINESTRING's (rivers or roads), and a few 'POLYGON's (lakes or regions). Write every geometry as an H2 geometry literal in the form 'GEOMETRY 'SRID=4326;<WKT>'' (WGS 84, longitude latitude order). Do not use 'ST_GeomFromText'. Finish with 'SELECT * FROM geo_sample ORDER BY id;'.
Execute the SQL script generated by the assistant, and open the resulting dataset in the map viewer to try out the map features described in this guide.