Navigating Table Relationships
Only in DbVisualizer Pro
This feature is only available in the DbVisualizer Pro edition.
In the Navigator tab, you follow the primary and foreign keys from rows in one table to the related rows in other tables. Each step is added to a graph, so you can see the path you took and go back to the data of any step.
Opening the Navigator
- In the Databases tab, double-click the table to start from.
- In its Object View tab, select the Navigator tab.
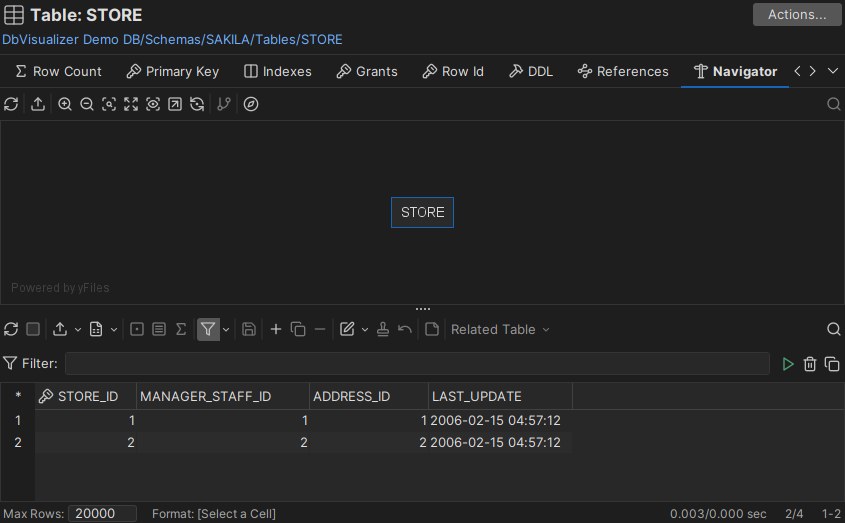
The tab has a graph and a data grid. At first, the graph only has the start table, and the grid shows its data. The grid works like the Data tab, with a Related Table list and a Tag button added.
If you have already filtered and sorted the data in the Data tab of a table, right-click the grid and select Show in Navigator. The Navigator opens with the same filter and sorting.
Following a relationship
In the examples, the STORE table has the primary key STORE_ID, and the CUSTOMER table has a foreign key that refers to it.
To see the customers of a store:
- In the grid of the STORE table, select a cell in the row of the store, here the store with STORE_ID
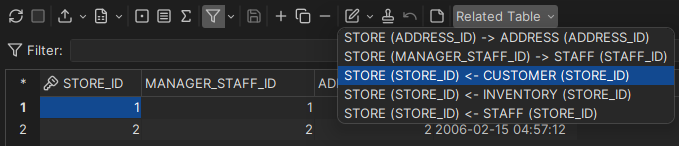
1. - Open the Related Table list. It lists the tables that STORE is related to through keys, with the key columns in parentheses. An arrow
->means that STORE refers to the other table, and<-that the other table refers to STORE. - Select STORE (STORE_ID) <- CUSTOMER (STORE_ID).
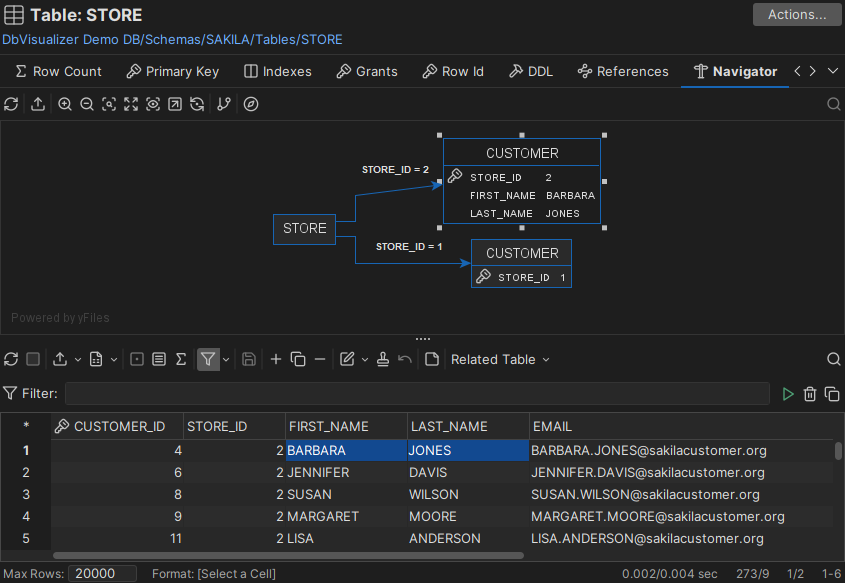
A node for CUSTOMER is added to the graph, with an arrow from STORE. This is a navigation case. The grid now shows the CUSTOMER rows with STORE_ID 1.
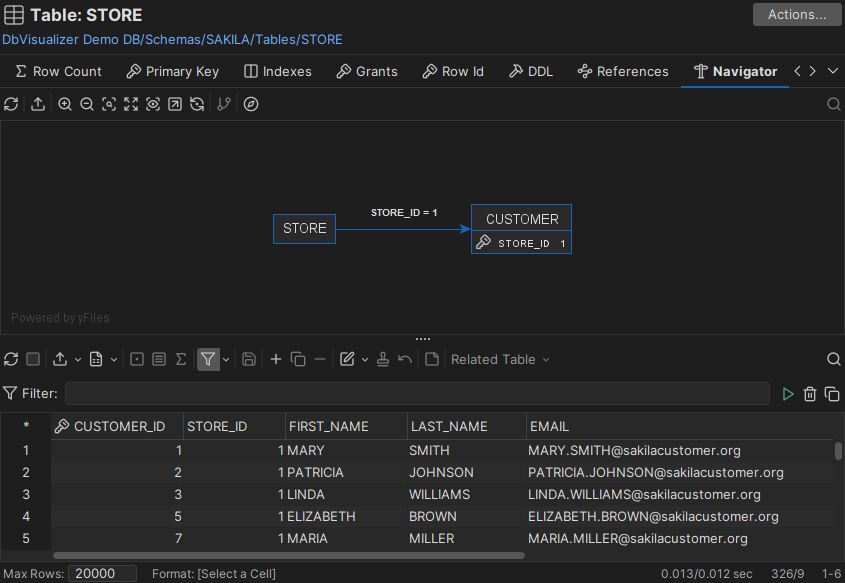
- The node shows the key columns and their values.
- The arrow shows the key column, and the columns you selected in the STORE row with their values. Select more cells in the row to show more information on the arrow.
You can edit the data in the grid. If you change a key value, the row disappears from the grid, since the grid only shows rows with the key value of the navigation case.
You can continue from any node in the graph. For example, go from CUSTOMER to its rentals, or select the STORE node, select another store in the grid, and select the same related table again.
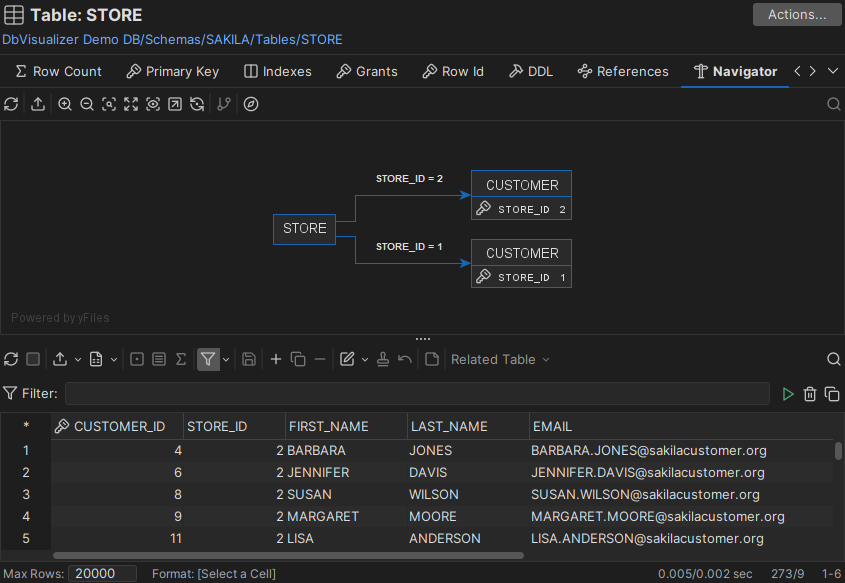
To create several navigation cases at once, select cells in several rows. One navigation case is created for each row.
When you select a node, the grid shows its data. Each node has its own grid settings, such as filters.
Tagging nodes
A node always shows its key columns. To add other values to it, so that it's easier to see what it stands for, tag it:
- Drag cells from the grid to a node.
- Or select a node and cells in the grid, and click the Tag button in the grid toolbar.
Arranging and exporting the graph
To move a node, drag it. The arrow and its label move with it. The graph toolbar has tools for removing nodes, zooming and exporting the graph as an image. To print the graph, use the right-click menu; see Printing.