Viewing Table Data
Some of the features on this page are only in DbVisualizer Pro.
The Data tab of a table shows its rows in a grid. You can sort them, filter them, search them, and choose which columns to show. This page describes how to find and look at data. To change it, see Editing Table Data. For tables with documents, such as in MongoDB, see also Working with Document Data.
Opening the Data tab
Double-click the table in the Databases tab, and select the Data tab in its Object View tab.
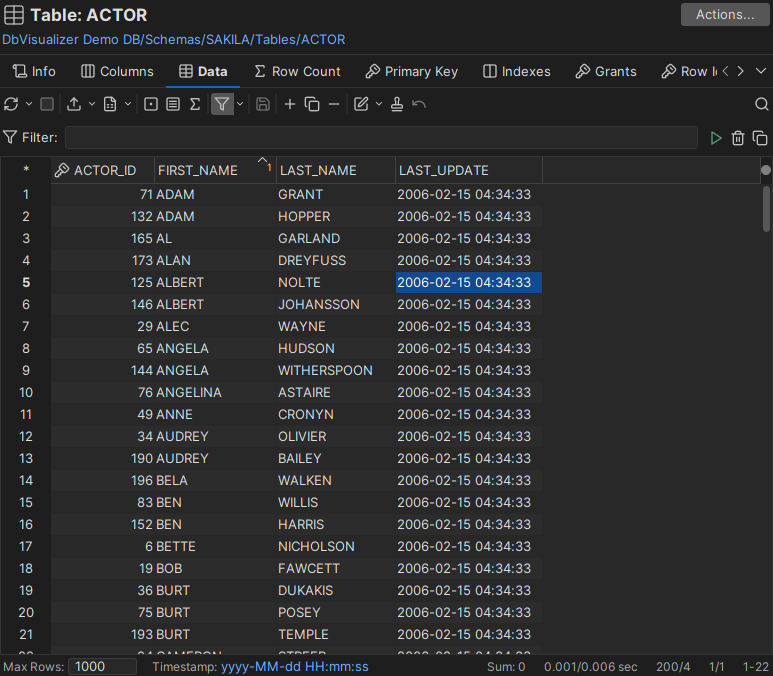
When you select a cell, the format used to show its value is shown below the grid. Click the link to change the date and number formats.
Sorting rows
- Click a column header to sort the rows by that column, in ascending order. An arrow in the header shows the sort order.
- Click the header again to sort in descending order, and a third time to show the rows in the order the database returned them.
- To sort by more columns, hold down
Ctrland click their headers. A number next to the arrow shows the order of the columns.
Filtering rows
A where filter limits the rows that are fetched from the database, like a WHERE clause. All filter actions are in the Filter menu in the grid toolbar.
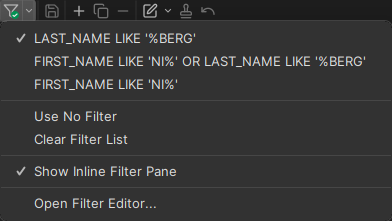
The top of the menu lists the filters you have used for the table, and the one in use is selected. To switch filters, select another one. Filters are kept when you restart DbVisualizer. To turn filtering off, select Use No Filter, and to delete all filters for the table, select Clear Filter List. How many filters to keep, and for how long an unused filter is kept, is set in the General / Table Data category in Tools → Tool Properties. By default, unused filters are removed after 12 months.
To create a filter:
Select Open Filter Editor in the Filter menu.
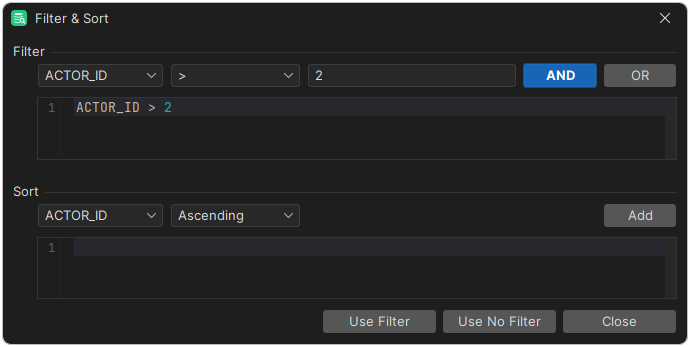
In the Filter area, select a column and an operator, and enter the value.
- Click AND or OR to add the condition. Add more conditions in the same way.
- Click Use Filter to use and save the filter, or Close to close the dialog without it.
The Sort area works the same way: select a column and a sort order, and click Add.
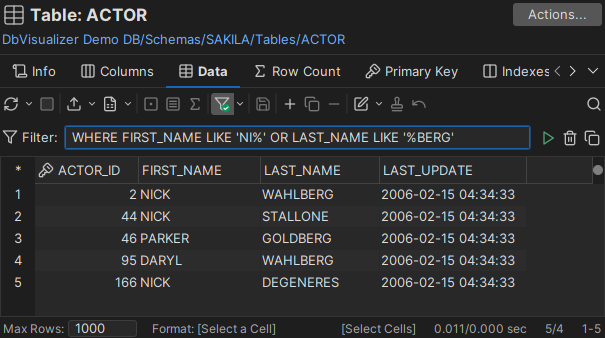
To edit a filter directly above the grid, select Show Inline Filter Pane in the Filter menu.
Filtering on column values
Only in DbVisualizer Pro
This feature is only available in the DbVisualizer Pro edition.
A column filter hides rows that are already in the grid, unlike a where filter, which limits the rows fetched from the database. To add one, click the right part of a column header, and choose the values to show. You can also write your own condition, for example to show rows where the value doesn't contain a text. A filter icon in the header shows that the column has a filter. You can add filters to several columns.
To look for a value in any column, use quick search instead.
Searching the grid
Quick search shows only the rows in the grid that contain a text. Like a column filter, it works on the rows already in the grid.
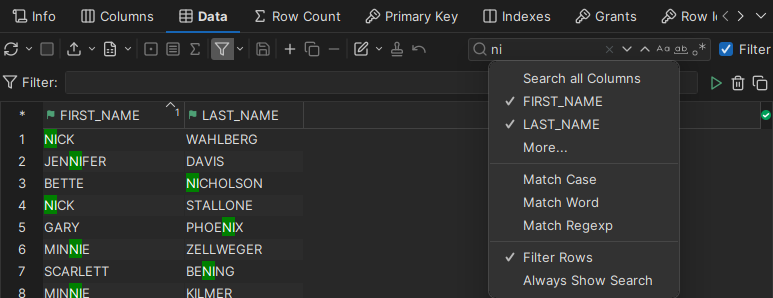
To search, click Find (the magnifying glass) in the grid toolbar, press Ctrl+F (Cmd+F on macOS), or start typing in the grid. The matches are highlighted as you type, and column headers are marked when the column has matches.
- Next to the search field are buttons for matching the case, matching whole words, and using regular expressions. They are hidden when the field is narrow. These and other options are also in the right-click menu of the search field.
- By default, all columns are searched. To search only some columns, right-click the search field and select them.
- By default, only the matching rows are shown. To show all rows and only highlight the matches, clear Filter next to the search field.
For more, see Using Quick Search.
Showing more rows
By default, the Data tab shows at most 20,000 rows, and long text values are cut off. See Setting Max Rows and Max Chars.
For some databases, you can also go through the data page by page, using the paging controls in the toolbar. The page size is the Max Rows value.

Choosing which columns to show
To hide columns or change their order, open the Grid Column Chooser: right-click a column header, or click the button above the vertical scroll bar.
- Select or clear a column to show or hide it. To show or hide all columns, use the buttons in the dialog.
- To change the order, select columns and use Up and Down, or drag them.
- To go back to all columns in their original order, click Default Layout.
An icon in the top right corner of the grid shows whether the layout is the default or has been changed:
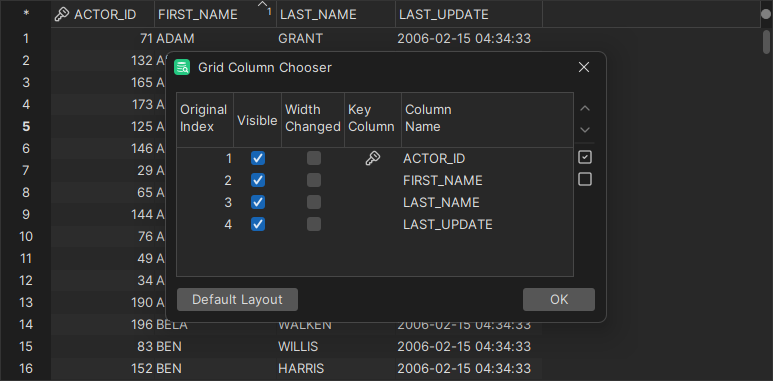
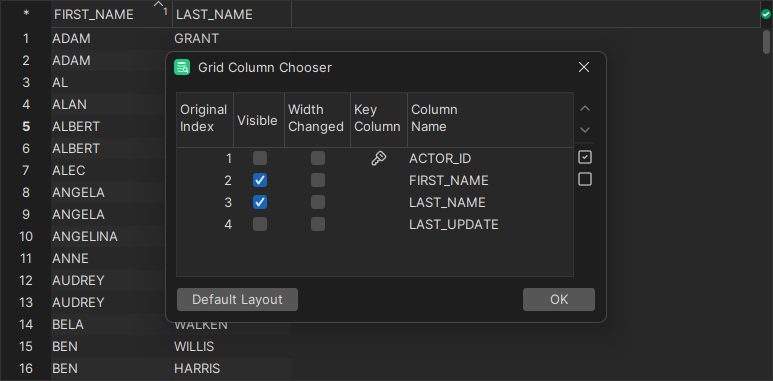
In the Data tab, the hidden columns and their order are kept until you restart DbVisualizer. In the other grids of Object View tabs, and in the Log tab, they are kept between restarts.
Column widths and line wrapping
Each column width is automatically resized to match the column width, including the column header, by default. You can disable this behavior in the the Tool Properties dialog, in the Grid category under the General tab.
If Auto Resize Column Widths is enabled, the Max Column Width setting can be used to limit the column width so that an extremely wide column does not take up all space.
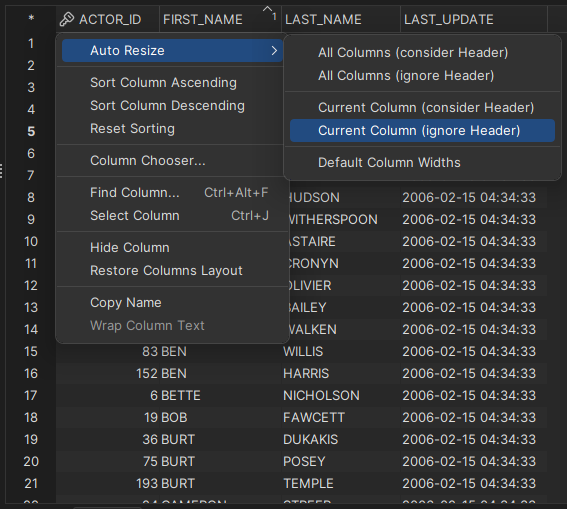
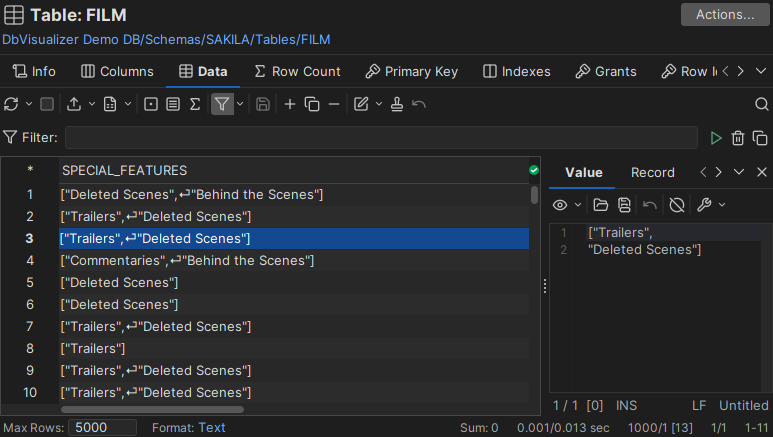
The right-click menu of a column header has more options for resizing columns, and for wrapping long text lines. Wrapping isn't available for binary columns, or for CLOB columns unless they are shown by value (see Viewing and editing binary/BLOB and CLOB data). In a column that isn't wrapped, line breaks are shown as a symbol. To see the whole text, double-click the cell to open the value viewer.
Column headers
To see the data type and other information about a column, point to its header.

Primary key columns have an icon in the header. To turn it off, use the General / Table Data category in Tools → Tool Properties.
- To show column aliases instead of the column names in the headers, use the General / Grid category. This is mostly useful for SQL Commander results.
- In read-only grids, such as the Data tab in DbVisualizer Free, you can hide the row numbers on the left, using Show Grid Row Header in the General / Grid category.
Copying and comparing data
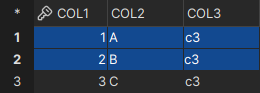
The right-click menu of the grid has many actions for working with the data without changing it. Most of the copy actions are in the Copy Selection As submenu. These examples use this grid with three columns, where the first two rows are selected:
| Action | Description |
|---|---|
| Copy Selection | Copy the selected cells. 1 A c3 |
| Copy Selection with Column Header | Copy the selected cells with the column headers. col1 col2 col3 |
| Copy Selection as Formatted Text | Copy the selected cells with the column headers, in columns of fixed width. col1 col2 col3 |
| Copy Selection as Comma List | Copy the selected cells as comma-separated values, one line per column. 1, 2 |
| Copy Selection as IN Clause | Copy the selected cells as IN conditions. (col1 IN (1, 2)) |
| Copy Selection as IN Clause with AND (ALL) | Copy the selected cells as a condition that matches rows where all values match. It doesn't match a row with 1, B, c3. (col1 = 1 and col2 = 'A' and col3 = 'c3') |
| Copy Selection as IN Clause with OR (ANY) | Like Copy Selection as IN Clause, but uses = for a column with only one value. It matches a row with 1, B, c3. (col1 IN (1, 2)) |
| Copy Selection as HTML Table | Copy the selected cells as an HTML table. |
| Copy Selection as Markdown Table (Jira etc) | Copy the selected cells as a Markdown table, for example for Jira. |
| Save Selected Cell | Save the value of the selected cell to a file. |
| Compare | Compare the data with another grid. |
| Compare Two Selected Cells | Compare the text of two cells. |
| Reset Grid | Reset the visual state of the grid. The column settings and the data aren't changed. |
| Value Viewer | Show the value of the cell in the value viewer. |
| Record Viewer | Show all values of the row in the record viewer. |
| Aggregates Viewer | Show aggregates, such as the sum, of the selected cells in the aggregates viewer. |
| Show in Navigator | Open the selected rows in the Navigator. |
| Describe Data | Show information about the columns in the grid. |
| Generate Filter & Sort | Create common where filters from the selection. |
| Extract Filter & Sort as SELECT | Copy a SELECT statement with the visible columns, the filter and the sorting of the grid. |
| Create Row Count Data Monitor | Create a monitor of the number of rows in the table. |
| Create Row Count Diff Data Monitor | Create a monitor of the number of rows added or removed. |
Generating SQL from rows
The actions in the Script to SQL Commander submenu of the right-click menu generate an SQL statement from the selected rows, and open it in a new SQL Commander tab. In DbVisualizer Free, this is how you change table data. In DbVisualizer Pro, you can also edit the data in the grid.
| Action | Example |
|---|---|
| SELECT ALL | SELECT * FROM COUNTRY; |
| SELECT ALL WHERE | SELECT * FROM SAKILA.COUNTRY WHERE COUNTRY = 'Brazil' |
| SELECT ALL WITH FILTER | SELECT * FROM SAKILA.COUNTRY WHERE COUNTRY_ID = 15, if that is the filter |
| INSERT INTO TABLE | INSERT INTO SAKILA.COUNTRY (COUNTRY_ID, COUNTRY) VALUES (15, 'Brazil') |
| INSERT COPY INTO TABLE | INSERT INTO SAKILA.COUNTRY (COUNTRY_ID, COUNTRY) VALUES (15, 'Brazil') |
| UPDATE WHERE | UPDATE SAKILA.COUNTRY SET COUNTRY_ID = 15, COUNTRY = 'Brazil' WHERE COUNTRY = 'Brazil' |
| DELETE WHERE | DELETE FROM SAKILA.COUNTRY WHERE COUNTRY = 'Brazil' |
By default, the statements use DbVisualizer variables instead of the values, so that you can change the values when you execute the statement. To use the values as they are, clear Include Variables in SQL in the General / Table Data category in Tools → Tool Properties.
For example, SELECT ALL WHERE for a row where COUNTRY is Brazil gives, with variables:
SELECT * FROM COUNTRY WHERE COUNTRY = ${COUNTRY (where)||Brazil||String||where ds=50 dt=VARCHAR}$;
And without variables:
SELECT * FROM COUNTRY WHERE COUNTRY = 'Brazil';
Creating monitors
A monitor runs a query at regular intervals, so that you can follow how the data changes, as a grid or a chart. The right-click menu of the Data tab has two ready-made monitors for the table: Create Row Count Data Monitor follows the number of rows, and Create Row Count Diff Data Monitor follows the number of rows added or removed.
Using the grid viewers
To see a single value, a whole row, or aggregates of the selected cells next to the grid, use the value viewer, the record viewer and the aggregates viewer. See Using the Grid Viewers.