Viewing Table Relationships
The References graph shows how a table is related to other tables through foreign keys. For an overview of all tables in a schema, see Viewing Entity Relationships.
Opening the graph
- In the Databases tab, double-click the table.
- In its Object View tab, select the References tab.
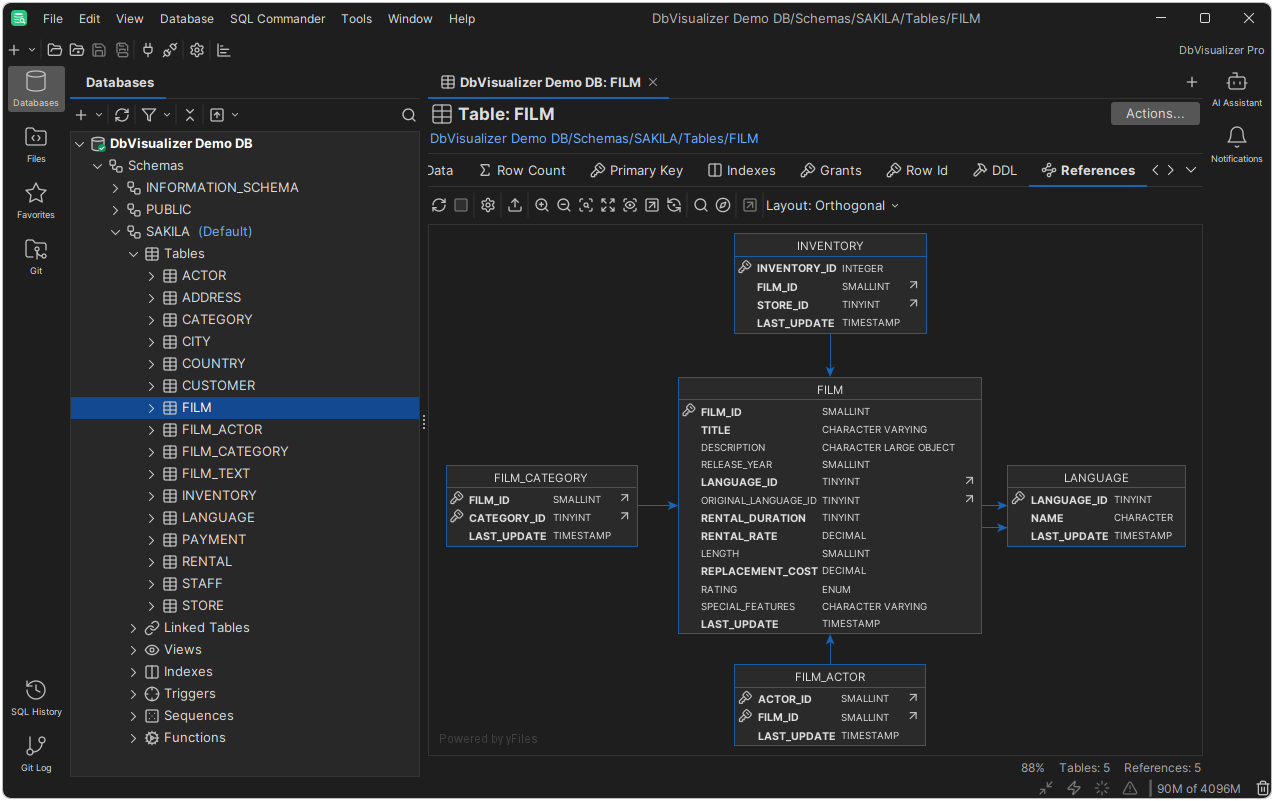
For a single table, the graph shows the links to and from that table. Choose which links to show: Inbound, Outbound, All or None.
Changing the layout
To choose the layout, use Layout in the toolbar: Hierarchical, Organic, Orthogonal or Circular.
To show or hide the Graph Controls area, click Show/Hide Graph Controls in the toolbar. There, you can:
- Choose how much to show for each table: only the Table Name, the Primary Key columns, or all Columns.
- Choose which links to show, and whether to highlight the links of selected tables.
Whether the table names are qualified with the schema or database is set in the Qualifiers category of the connection properties.
Some settings, such as Links to Columns, are only available in the Hierarchical layout.
Highlighting links
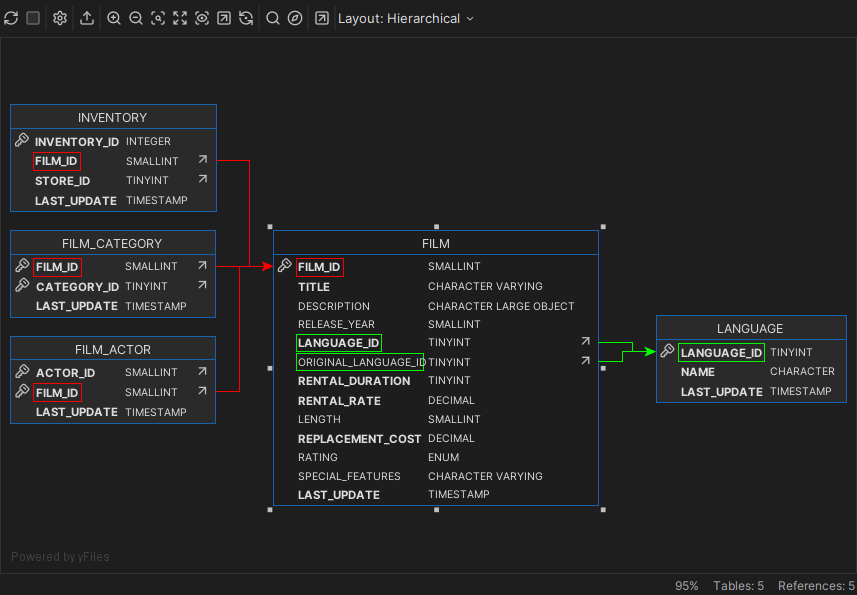
In the Hierarchical layout with Links to Columns and Highlight Links selected, the links and columns of the selected tables are colored:
- Green: foreign key columns and outgoing links.
- Red: primary key columns and incoming links.
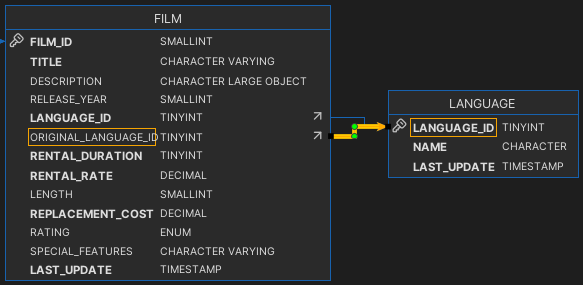
- Orange: columns used for both, and links between two selected tables.
Click a link to highlight the columns it connects:
Exporting the graph
To save the graph as an image, export it as JPG, GIF, PNG, SVG, PDF or EMF. To edit it in the yEd graph editor, save it as a GML file, using Save As in the right-click menu.