intro
A curated guide to the best database tools for analysts, covering SQL clients, BI platforms, data quality solutions, and more.
The modern analyst’s toolkit goes well beyond dashboards. In fact, there is a wide range of database tools that can support every step of your analytics journey.
Here’s a practical, category by category guide to the database tools that help you explore data, answer questions fast, and share insights that stick. Let’s dive in!
What Is a Database Tool for Analysts?
A database tool for analysts is any software application that supports working with data throughout the analytics lifecycle. These tools make it possible to connect to databases or data warehouses, query information, transform and clean datasets, validate data quality, and communicate insights effectively. In other words, they support data analysts in (almost) all aspects of their job.
Why Analysts Need Specific Database Tools
Analysts tend to sit at the intersection of business questions and raw data. That means your day to day is heavy on:
Time to see a list of database tools for analysts below, organized around these needs.
Top 10 Database Tools for Analysts
Explore a curated list of database tools designed specifically for analyst users, organized by category.
Note: Categories may overlap. The goal is to help you map problems to tools quickly, not to debate strict taxonomy.
1. Everyday Data Querying, Editing, and Exploration: SQL Clients
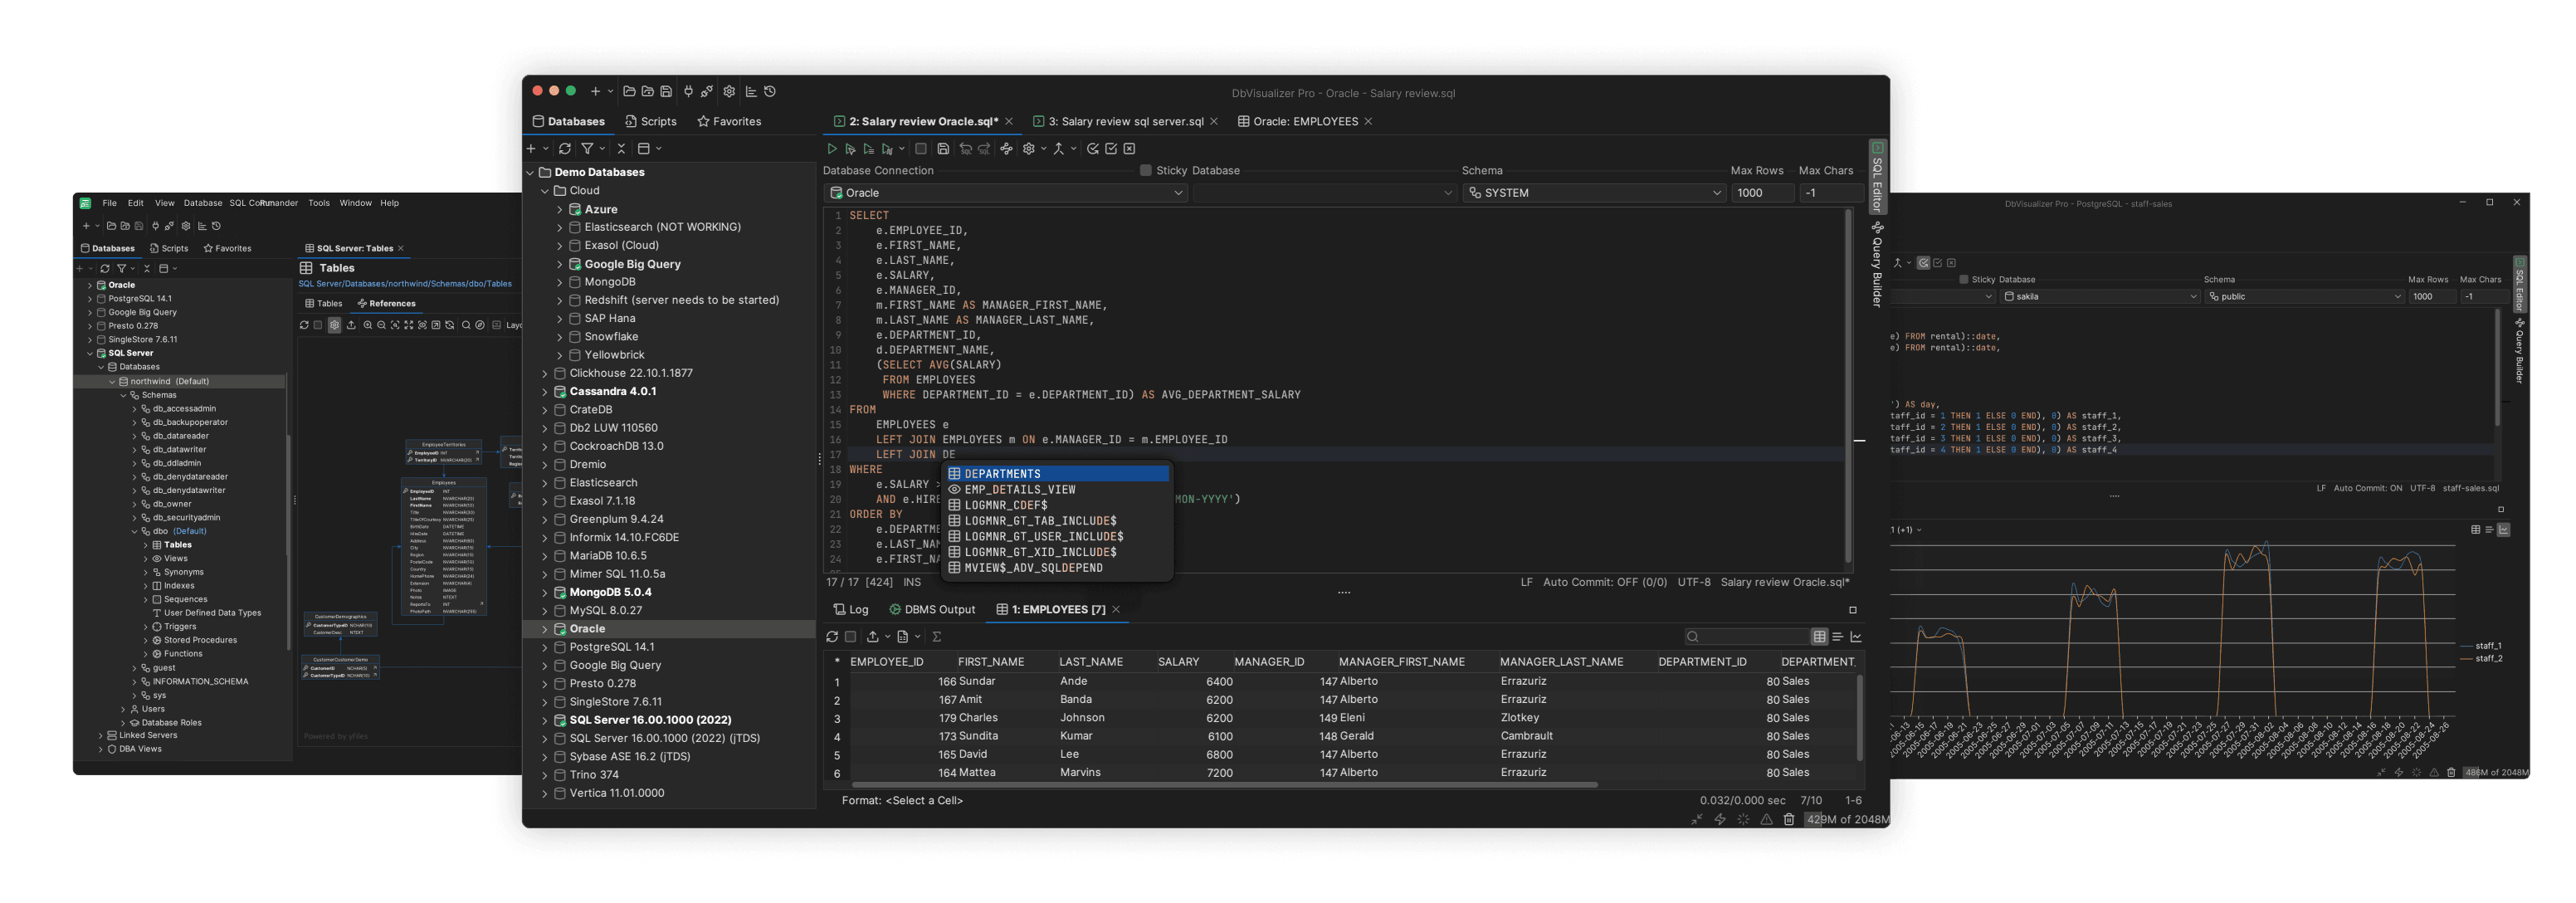
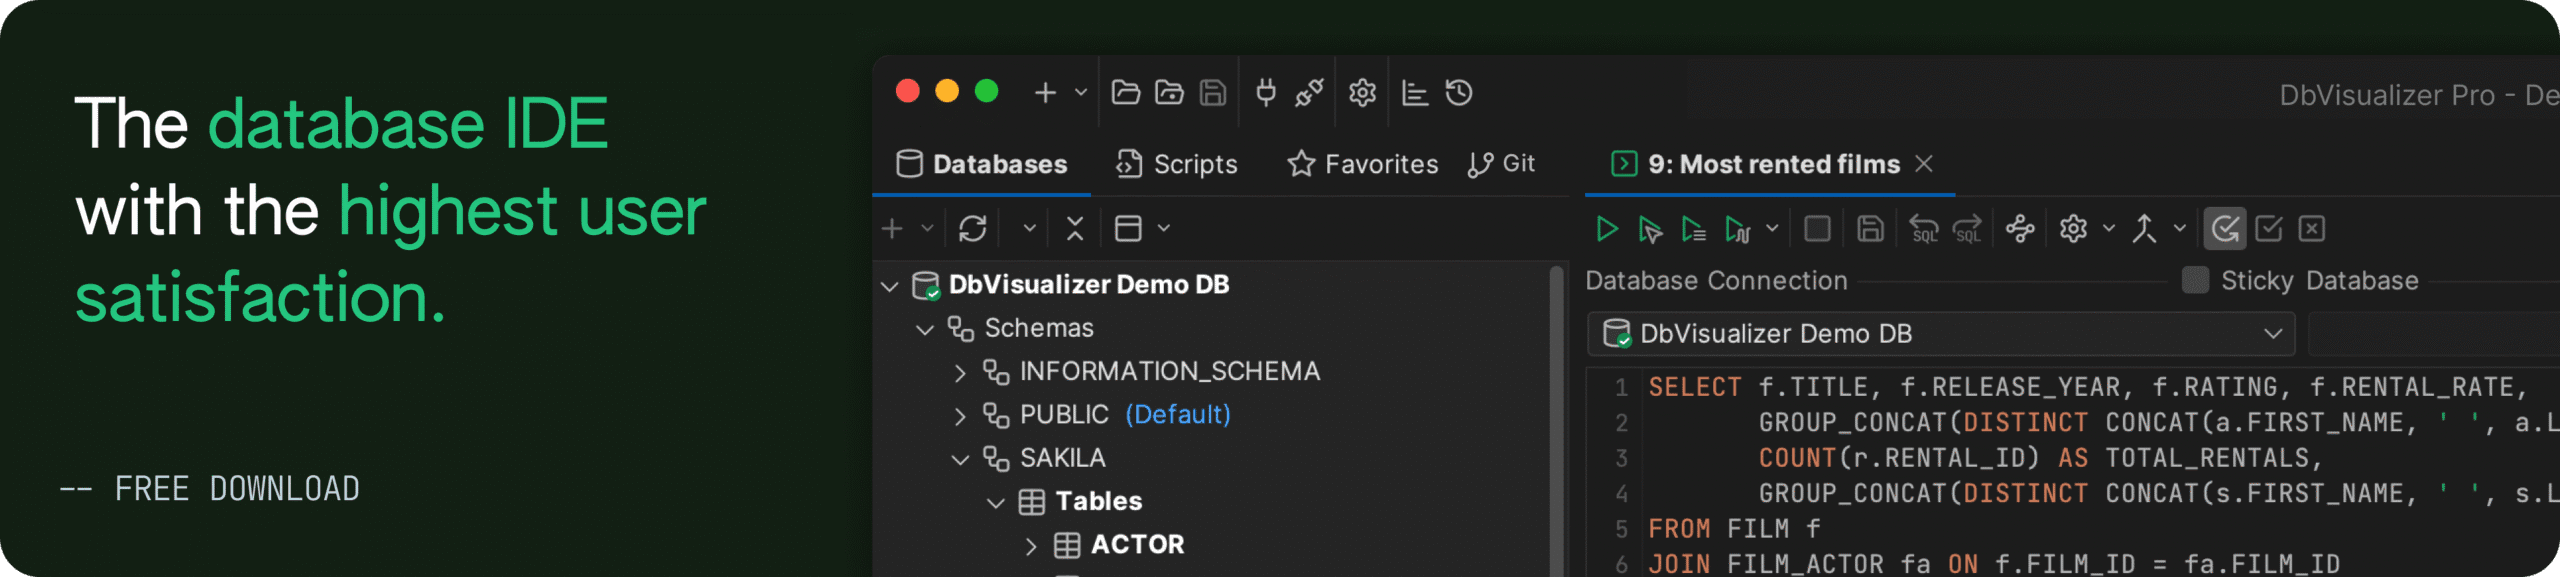
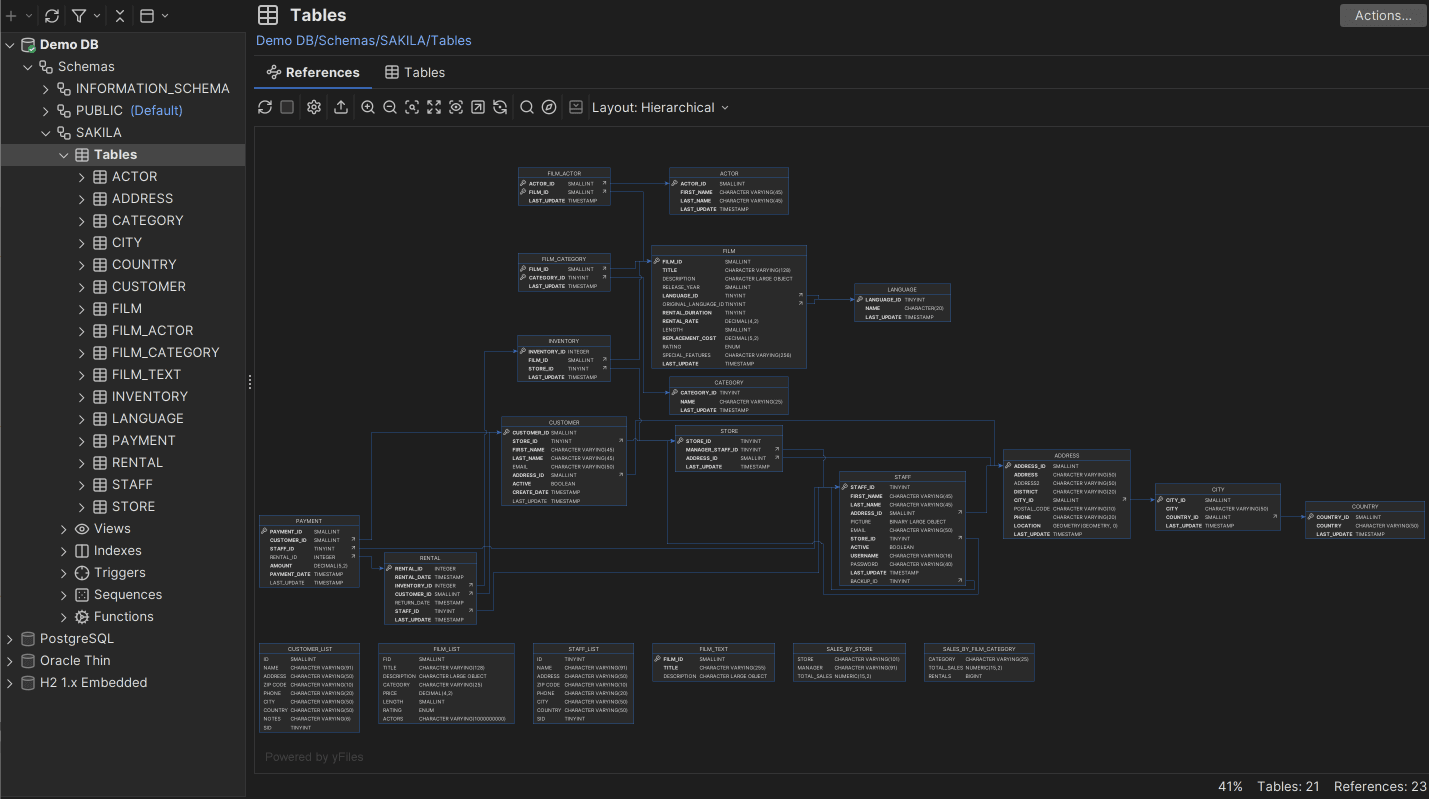
DbVisualizer, a top-rated SQL database client
A great SQL client is the analyst’s power tool: fast to connect, friendly to explore schemas, helpful when composing queries, and reliable when you need to export, chart, or monitor results.
Examples:
| Tool | Why analysts use it |
|---|---|
| DbVisualizer | Top rated, multi database SQL client for analysts. Highlights include a visual query builder for no code joins, ER or reference graphs for understanding relationships, spreadsheet style data editing and export, result set charts, simple SQL monitors, and Git integration for scripts. |
| DataGrip | Commercial IDE with smart SQL, refactors, and rich database introspection across many engines. |
| DBeaver | Open source plus commercial editions with wide database coverage, ER diagrams, and a familiar UI. |
| TablePlus | Polished UI and speedy local work with support for popular relational engines and basic NoSQL. |
| Azure Data Studio | Free Microsoft tool that is handy when you live in the SQL Server ecosystem. |
Why DbVisualizer stands out for analysts:
Further reading:
2. Shareable, Governed insights: BI and Dashboarding
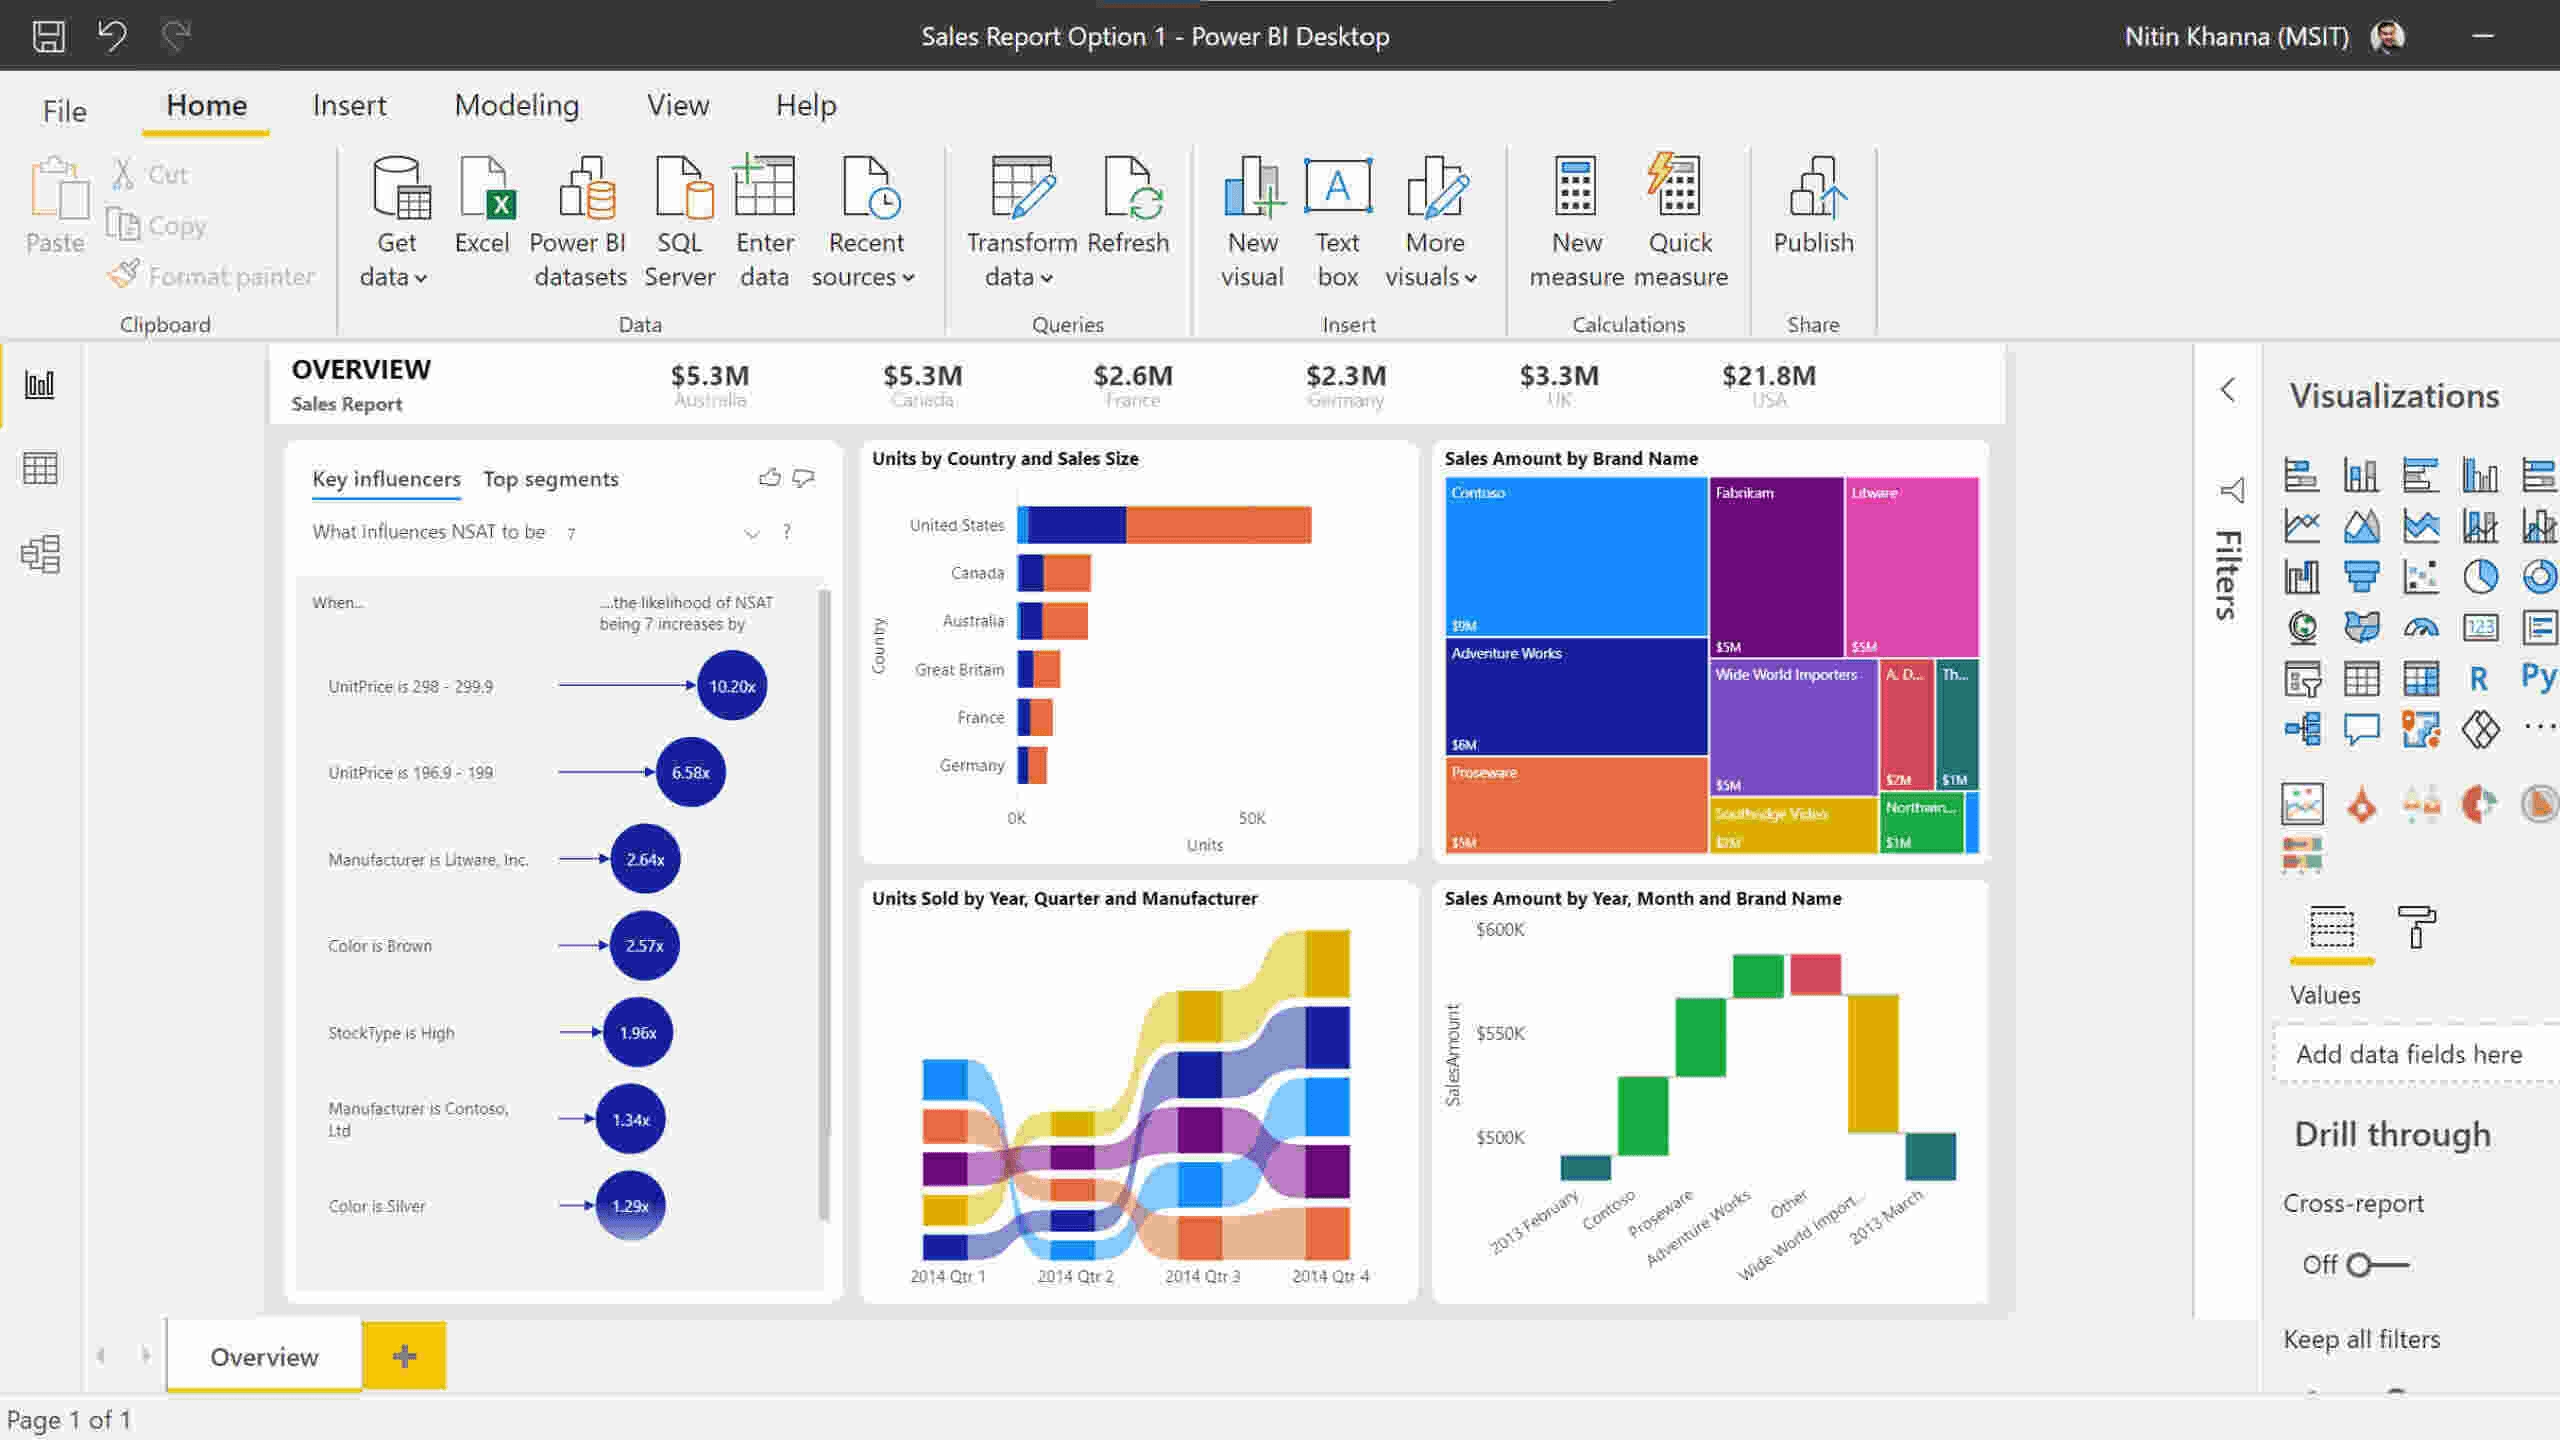
BI (Business Intelligence) platforms make it easy to turn queries into curated, shareable dashboards with permissions, refresh schedules, and interactive slicing.
Examples:
| Tool | Why analysts use it |
|---|---|
| Power BI | Deep Excel and Office integration, semantic models, strong governance. |
| Tableau | Flexible visual analytics, strong storytelling, large community. |
| Looker | Semantic layer with LookML for governed metrics across teams. |
| Metabase | Simple, open source SQL and auto charts that non technical users can click through. |
| Apache Superset | Open source dashboarding at scale with a cloud native mindset. |
If you prefer to avoid a standalone BI platform, DbVisualizer can chart query results inline, which is useful for exploratory visuals before you formalize a dashboard.
Further reading:
3. From Raw to Analysis-Ready: Data Preparation and ELT

Analysts often contribute to the T (Transform) in ELT (Extract, Load, Transform): modeling raw tables into clean, documented datasets.
Examples:
| Tool | Role |
|---|---|
| dbt | SQL first transformations with testing and documentation. |
| Airbyte / Fivetran / Stitch | Managed connectors to load data into your warehouse. |
| Matillion | ELT on cloud warehouses with visual pipelines. |
| Dataform (BigQuery) | Native modeling for the Google Cloud stack. |
Further reading:
4. Reproducible Storytelling: Notebooks and Interactive Analysis
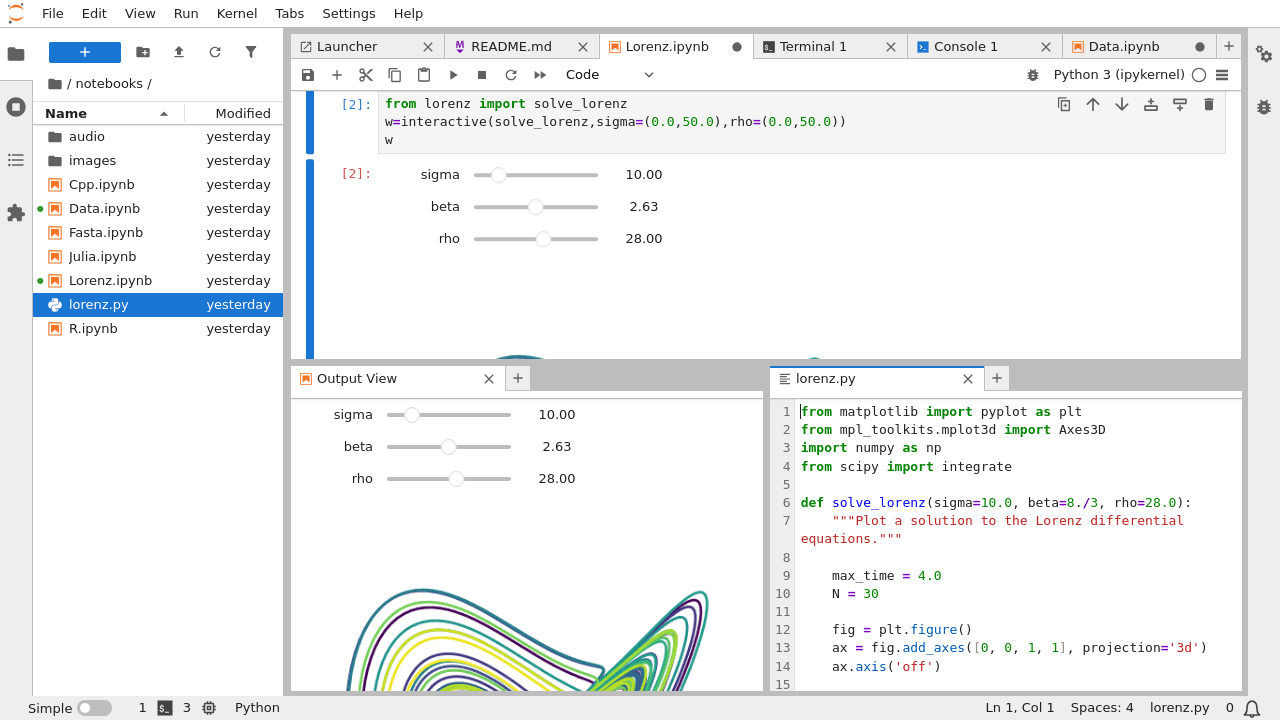
Notebooks in JupyterLab, one of the most widely used solutions for data storytelling and narrative analysis
When you need code, narrative, and charts in one place, notebooks shine.
Examples:
| Tool | Why analysts use it |
|---|---|
| Jupyter / JupyterLab | Python, R, and SQL in one notebook with a large ecosystem. |
| Hex | SQL plus Python notebooks with strong collaboration and app like outputs. |
| Deepnote | Real time collaboration and SQL blocks; classroom friendly. |
| Zeppelin | Polyglot notebook for JVM ecosystems. |
| Mode | SQL notebooks with built in visualization and reporting. |
Do you prefer not to use a standalone notebook? Keep a library of parameterized SQL scripts in Git and run them from DbVisualizer when you do not need a full notebook.
Further reading:
5. Make Data Structure Clear: Data Modeling and ER Diagramming
Clear models speed up analysis by showing how tables relate.
Examples:
| Tool | Strength |
|---|---|
| DbVisualizer | Auto generates references or ER graphs from your database so you can see keys and relationships quickly. Great for onboarding and hand offs. |
| DbSchema | Visual schema design, documentation, and data compare. |
| ER/Studio / ERwin | Enterprise grade modeling and governance features. |
| Vertabelo | Browser based modeling with collaboration. |
| draw.io / Lucidchart | Lightweight diagrams for quick architecture sketches. |
Further reading:
6. Trust Your Tables: Data Quality and Profiling
Proactive checks keep bad data from leaking into decision making.
Examples:
| Tool | Focus |
|---|---|
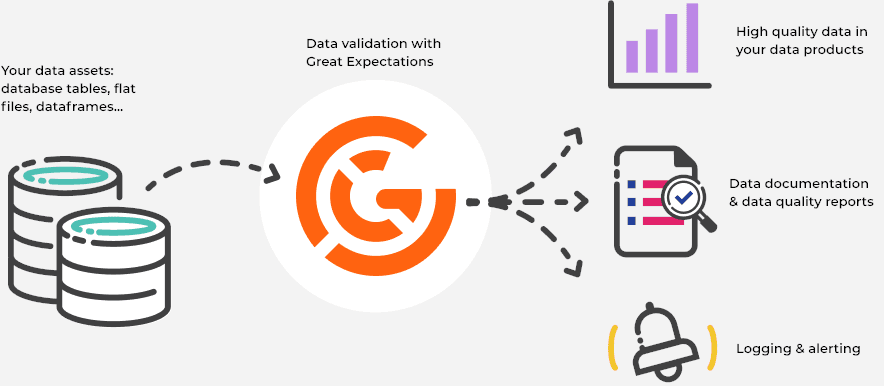
| Great Expectations (GX) | Declarative data tests in Python that are warehouse friendly. |
| Soda | Monitoring and testing with alerting. |
| Monte Carlo / Metaplane | Data observability for freshness, volume, and schema with lineage hooks. |
| dbt tests | Lightweight assertions embedded in your models. |
Further reading:
7. Findability and Context: Catalog, Lineage, and Governance
As datasets multiply, analysts need a searchable catalog, owners, and lineage to understand what is safe to use.
Examples:
| Tool | Sweet spot |
|---|---|
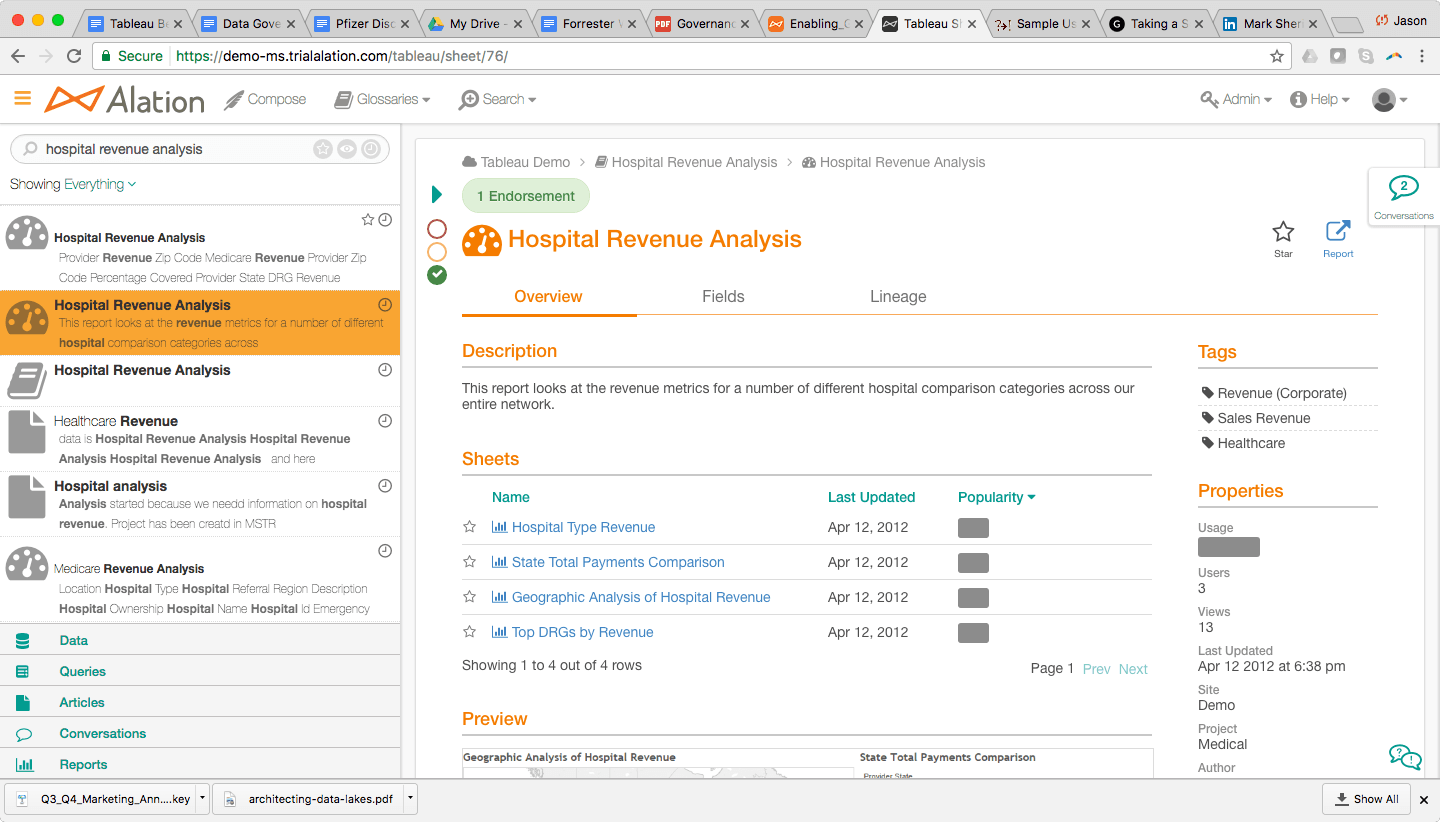
| Alation / Collibra | Enterprise data governance and stewardship. |
| Atlan | Modern, collaboration forward catalog with Slack or Teams hooks. |
| OpenMetadata / Amundsen | Open source catalogs with lineage integrations. |
Further reading:
8. From Ad Hoc to Reliable: Scheduling and Orchestration

Apache Airflow, one of the best tools for workflow orchestration
Turn repeatable analyses into dependable jobs with retries, alerts, and dependencies.
Examples:
| Tool | Strength |
|---|---|
| Apache Airflow | DAG (Directed Acyclic Graph) scheduler with a large ecosystem. |
| Dagster | Data aware orchestration with typed assets. |
| Prefect | Pythonic orchestration with a friendly developer experience. |
| dbt Cloud Jobs / cron | Lightweight scheduling for SQL only workflows. |
If you would rather avoid specific orchestration tools, use the command line interface in DbVisualizer to run scripts from schedulers and keep SQL logic versioned in Git.
Further reading:
9. Keep Queries Snappy: Database Performance and Monitoring
Slow queries kill momentum. Observability tools help you spot bottlenecks and fix them.
Examples:
| Tool | Focus |
|---|---|
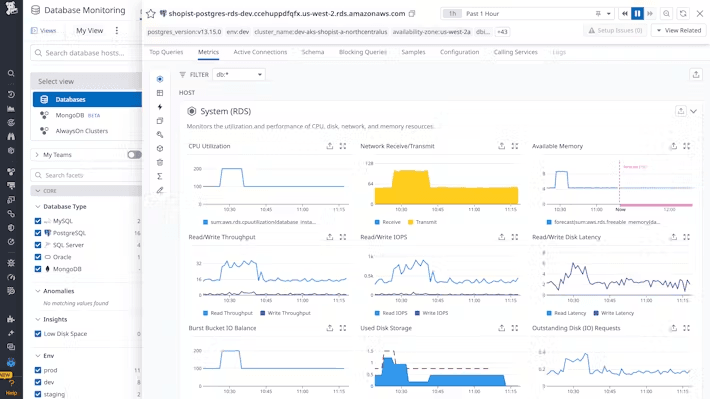
| Datadog Database Monitoring | Cross engine performance tracking with alerts. |
| pganalyze | Deep Postgres insights including plans, bloat, and tuning. |
| New Relic, SolarWinds DPA | APM (Application Performance Monitoring) suites with database modules. |
You will also get far in your query tuning by using Explain Plan and data monitors in DbVisualizer to profile queries and watch key metrics while you iterate.
Further reading:
10. Work in a Team: Collaboration, Versioning, and Workflow

Analysis gets better when it is reviewable and repeatable.
Examples:
| Tool | What it adds |
|---|---|
| GitHub / GitLab / Bitbucket | Pull request reviews, code history, and CI hooks for analytics code. |
| DbVisualizer | Built in Git integration to clone repos, switch branches, and track SQL scripts alongside your queries. |
| Confluence / Notion | Lightweight documentation for playbooks and runbooks. |
Further reading:
Conclusion
Analysts thrive with a focused core (a fast SQL client plus a BI tool) and a supporting cast (ELT, quality, lineage, orchestration). If you are consolidating your day to day querying and exploration, DbVisualizer is a strong universal SQL client. It spans many databases, smooths out the learning curve with visual aids, and packs handy features for charting, monitoring, and versioning, so you can move from question to answer faster.
Do you think we missed any analyst-ready tools, or would you like to collaborate in the future? We would love to hear from you!
FAQ
What are the main types of analyst database tools?
At a minimum: SQL clients, BI or dashboarding, ELT or modeling, notebooks, data quality, catalog and lineage, orchestration, and performance monitoring. Most teams standardize on one per category and add niche tools as needed.
Do analysts still need SQL if we have a BI tool?
Yes, they do. BI tools are excellent for governed metrics and self service, but SQL remains the lingua franca for exploratory work, ad hoc questions, and debugging data issues.
Open source or commercial: what is best?
Use open source when you want flexibility and low cost. Choose commercial when you need support, security features, or advanced UX at scale. Many teams mix both.
How should I choose my SQL client?
Prioritize multi database support, great ergonomics such as autocomplete and a schema browser, explain plans, visual helpers when useful such as ER graphs and query builders, and quality of life features like charting, monitors, and Git integration. DbVisualizer supports all that, which is why it is a solid choice for most analysts.