intro
Discover the list of the most important database tools for business users, organized by category and carefully selected.
Business users make decisions every day. The right tools help you get answers quickly, explore data with confidence, and share insights in a format your team understands. In this guide, you will see the categories of databases that matter for business users, broken down by type, along with a clear list of tools you can try today.
Let’s dive in!
What is a Database Tool for Business Users?
A database tool for business users is any application that helps non-technical users connect to trusted data, explore it, and communicate insights. Common tasks for such a tool include providing quick answers to questions, performing lightweight analysis, generating recurring reports, and creating shareable dashboards.
Why Business Users Need Their Own Set of Tools
The main reasons why business users needs specific database tools are:
Time to see the most useful database tools for business users, organized by the most important categories
Top Database Tools for Business Users
Explore a curated list of database tools designed specifically for business users, organized by category.
Note: Categories can overlap, so select the tools that best fit your business needs.
1. Dashboards and Self-Service BI
These tools let you browse trusted datasets, build charts, and answer follow-up questions without writing code.
Examples:
| Tool | Why business users like it |
|---|---|
| Tableau | Flexible visuals and storytelling, great training resources. |
| Power BI | Good governance and ties in with Excel. |
| Looker | Central metric layer so teams see one version of the truth. |
| Metabase | Simple questions and auto charts, good for internal portals. |
| Looker Studio | Free, easy to connect to common sources and share links. |
If you are not ready to adopt a full BI platform, DbVisualizer can turn any query result into quick charts and exports, which is useful for one-off reports or early prototypes.
Further reading:
2. Spreadsheets Connected to the Warehouse
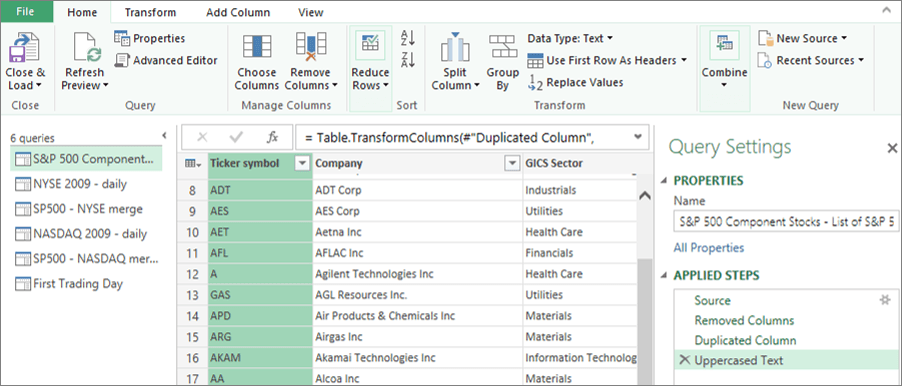
Power Query in Excel
Most teams still live in spreadsheets. Connect them to your warehouse to reduce copy-paste and stale CSVs.
Examples:
| Tool | Why business users like it |
|---|---|
| Excel with Power Query | Pulls data from databases and shapes it for analysis. |
| Google Connected Sheets | Live connection to BigQuery inside Sheets. |
| Coefficient | Syncs warehouse tables into Google Sheets with refresh schedules. |
| Supermetrics | Prebuilt connectors for marketing and ad platforms into Sheets or Excel. |
If you only need periodic extracts, DbVisualizer can query any JDBC source and export straight to CSV or Excel, then you can keep the lightweight analysis in your spreadsheet.
Further reading:
3. Natural Language and Search-First Analytics
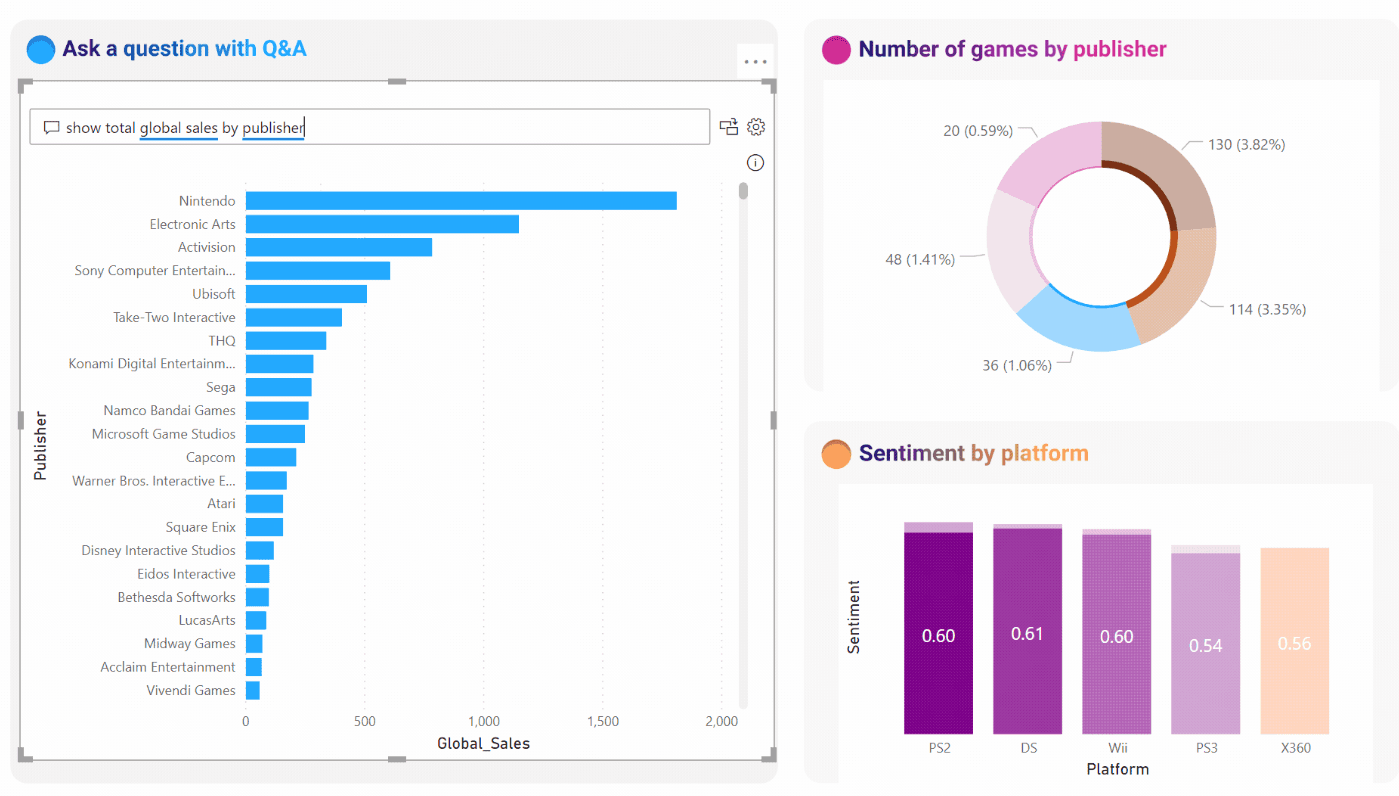
Ask questions in plain language, search for metrics, and let the tool suggest visualizations.
Examples:
| Tool | Why business users like it |
|---|---|
| Power BI Q&A | Natural language on top of curated models. |
| ThoughtSpot | Search bar for analytics, good for ad hoc questions. |
| Tableau Ask Data | Query with plain text on governed data sources. |
If your team prefers simple guided queries over freeform search, DbVisualizer has a visual query builder that helps you create the right joins without writing SQL by hand.
Further reading:
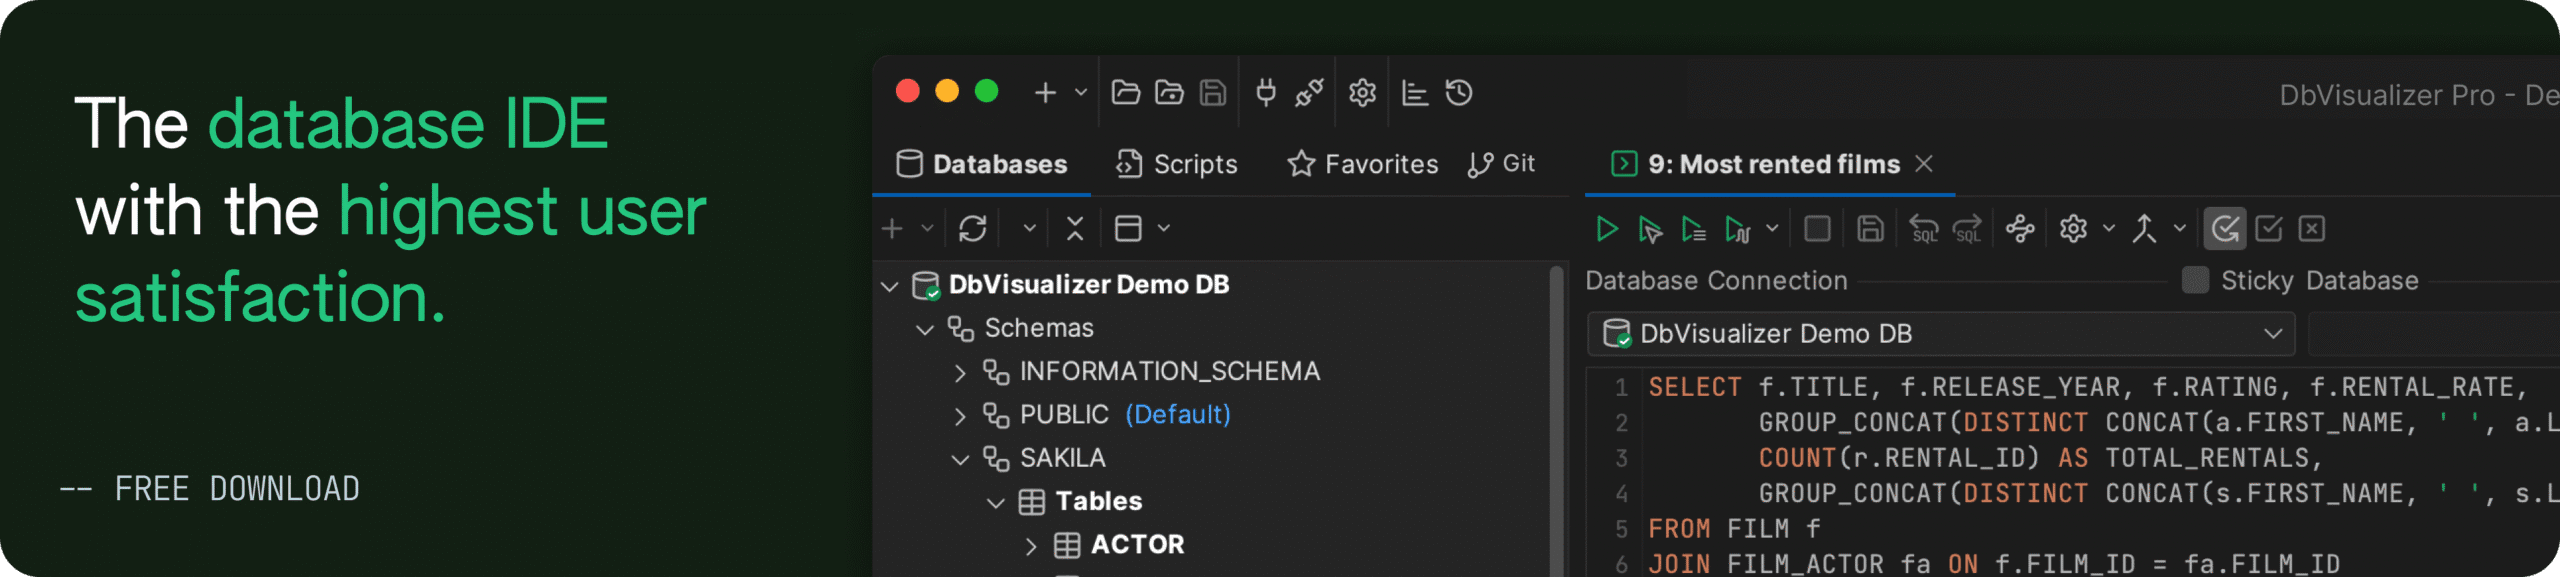
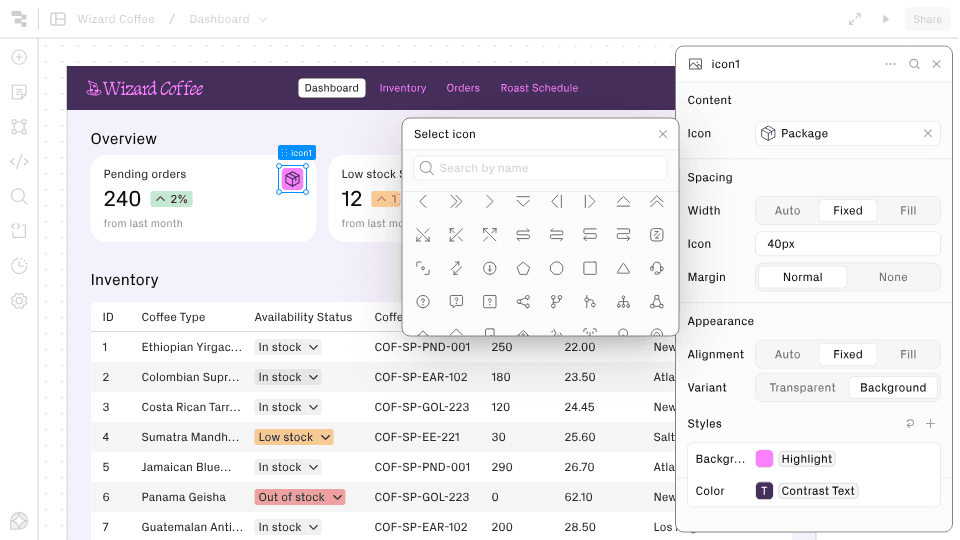
4. Lightweight SQL Clients for Power Users
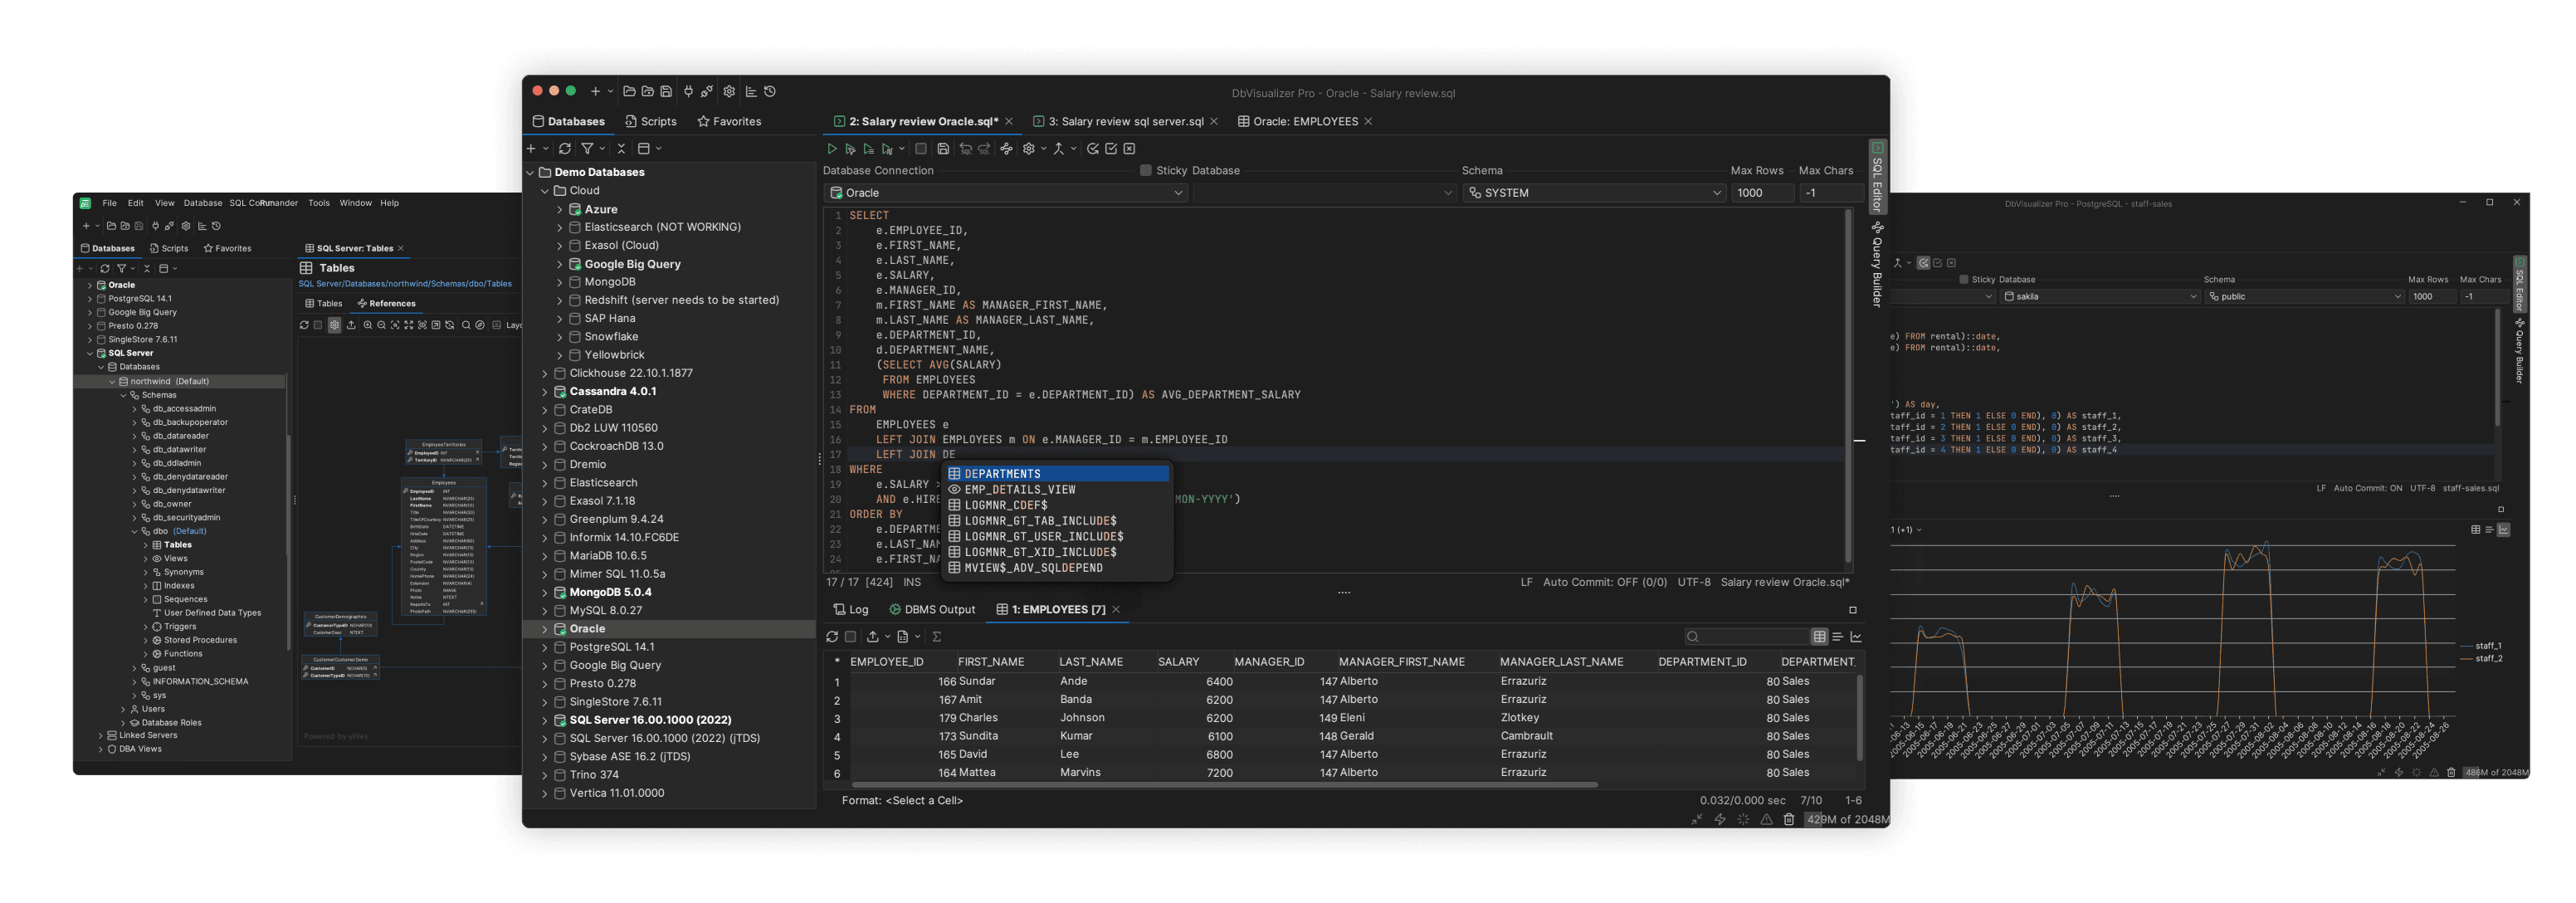
DbVisualizer, a top-rated SQL database client
Some business users are comfortable with simple SQL. A friendly client makes it easier to explore schemas and reuse queries.
Examples:
| Tool | Why business users like it |
|---|---|
| DbVisualizer | Universal SQL client with visual query builder, ER graphs, result-set charts, Git for scripts, and monitors for auto-refreshing queries. |
| TablePlus | Polished interface for popular databases. |
| DBeaver | Open source with wide driver support. |
If you are choosing a single SQL client, DbVisualizer is a strong default for mixed database environments and quick analysis. Its customer list includes Volkswagen, Tesla, Spotify, Google, Meta, and even NASA, which shows it is definitely business-ready.
Further reading:
5. Team Reporting and Scheduled Delivery
Turn recurring questions into reports that arrive on a schedule by email or chat.
Examples:
| Tool | Why business users like it |
|---|---|
| Mode | SQL + visual reports with scheduling and sharing. |
| Metabase | Subscriptions for dashboards and pulses. |
| Looker | Scheduled delivery to email and Slack with filters. |
If you only need a small set of checks, you can save queries in DbVisualizer and use real-time data monitors to auto-refresh results while you are working, then export and share as needed.
Further reading:
6. Documentation and Data Guides
Good documentation helps people choose the right metric and avoid duplicate logic.
Examples:
| Tool | Why business users like it |
|---|---|
| Notion | Easy to maintain playbooks and glossary pages. |
| Confluence | Structured documentation with access control. |
| Coda | Docs that can pull live data and produce mini apps. |
Further reading:
7. Data Catalogs and Search
Catalogs make datasets discoverable and add owners, descriptions, and quality context.
Examples:
| Tool | Why business users like it |
|---|---|
| Atlan | Collaboration features and easy search across sources. |
| Alation | Enterprise governance and stewardship workflows. |
| Castor | Clean UI focused on adoption by business users. |
If you only need occasional discovery, opening a database in DbVisualizer and browsing the schema can be enough to orient yourself before you ask the data team for access.
Further reading:
8. Data Capture and Forms

Collect structured inputs that flow into your reports and dashboards.
Examples:
| Tool | Why business users like it |
|---|---|
| Typeform | Friendly forms with integrations. |
| Google Forms | Free and fast for internal surveys. |
| Airtable Forms | Inputs that land straight into a table you can filter and share. |
If you plan to validate or enrich the collected data with quick queries, you can pull it into DbVisualizer and run sanity checks before sending it downstream.
Further reading:
9. Data Apps and Internal Tools
Build small tools for approvals, lookups, and workflows on top of your data.
Examples:
| Tool | Why business users like it |
|---|---|
| Retool | Drag and drop components on top of databases and APIs. |
| Appsmith | Open source builder for internal tools. |
| Airtable Interfaces | Simple apps on top of Airtable bases. |
If you only need a quick view or export and not a full app, DbVisualizer can give you the filtered dataset you need in minutes.
Further reading:
10. Quality Checks You Can Understand
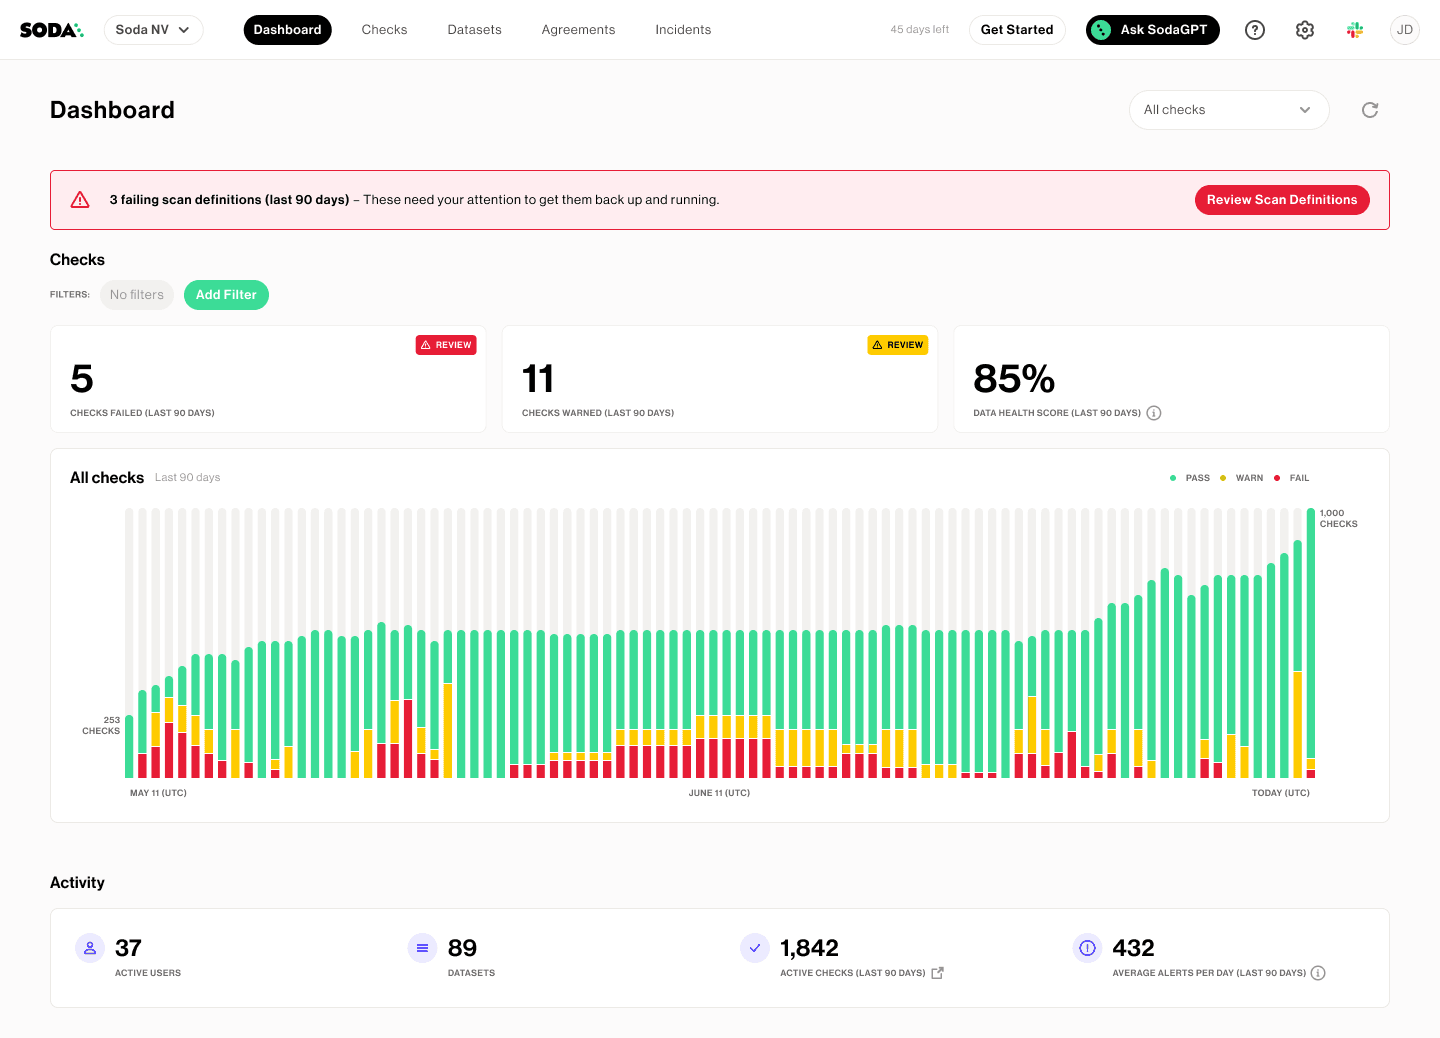
The Soda Data Quality solution, a possible tool for this category
Trust is everything. Simple checks can catch obvious issues before a report goes live.
Examples:
| Tool | Why business users like it |
|---|---|
| Soda | Views that alert when freshness or volume looks wrong. |
| Great Expectations | Declarative tests that can be explained in plain terms. |
| Built-in BI tests | Many BI tools support basic warnings on missing or stale data. |
If you are not using a dedicated testing tool, you can keep a folder of sanity-check queries in DbVisualizer and run them with a click, then compare results over time.
Further reading:
Summary
In this blog post, you explored a list of database tools for business users. If you are wondering how to get started with these solutions, consider selecting an SQL client. In that case, DbVisualizer is a solid choice.
DbVisualizer connects to many databases via JDBC, includes a visual query builder, displays ER relationships, turns query results into quick charts, and stores reusable SQL in Git. This supports most of your business needs.
Do you think we missed any particular business-oriented tool or want to collaborate in the future? We would love to hear from you!
FAQ
What tools do I need if I am new to data?
Start with a simple dashboard tool and the spreadsheet where you currently handle your data. Then, add a SQL client when you want faster answers than waiting for a new report.
Do I need to learn SQL?
Sure, that would help. Even a little SQL makes you faster and more independent. For example, visual query builders in tools like DbVisualizer reduce the amount you need to write by hand.
Can I skip BI if I have spreadsheets?
You can, but dashboards make sharing and refresh much easier. Use spreadsheets for flexible analysis and BI (Business Intelligence) for the views you repeat.
How do I avoid conflicting numbers?
Choose a source of truth, document key metrics, and share links to the same reports rather than screenshots. When in doubt, check the schema relationships first so you select the right tables. DbVisualizer helps there with ER graphs you can inspect before you query.