ObjectsViewDef
The ObjectsViewDef element defines the views for the object types in the objects tree. The views are shown in the Object View for the selected object. Which views are shown depends on the object type of the selected node and the matching ObjectView element.
<ObjectsViewDef extends="true">
   <ObjectView type="xxx">
      <DataView id="yyy" label="yyy">
         ...
      </DataView>
   </ObjectView>
</ObjectsViewDef>
The extends="true" attribute means that this definition extends the ObjectsViewDef element in the extended database profile.
All database profiles should extend the generic profile as the top-level profile.
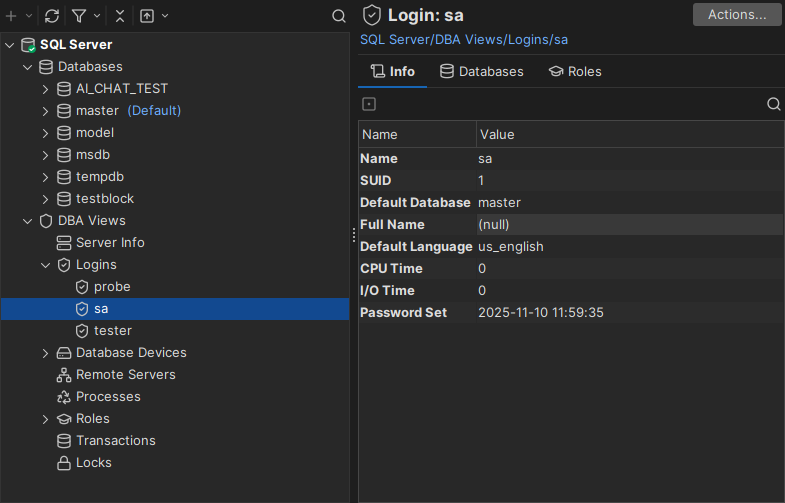
When you open an object in the objects tree (sa in the screenshot below), an object view tab is created for it. Each DataView element in the ObjectView is shown as a tab in the object view. The selected object and its data are passed to each data view. The following example shows an object view and its ObjectView definition.
The object view in DbVisualizer:
The XML definition:
<ObjectView type="Logins">
   <DataView id="sqlserver-logins-logins" label="Logins" viewer="grid">
      <Command idref="sqlserver.getLogins"/>
   </DataView>
</ObjectView>

<ObjectView type="Login">
   <DataView id="sqlserver-login-info" label="Info" viewer="node-form"/>
   <DataView id="sqlserver-login-databases" label="Databases" viewer="grid">
      <Command idref="sqlserver.getLoginDatabases"/>
   </DataView>

   <DataView id="sqlserver-login-roles" label="Roles" viewer="grid">
      <Command idref="sqlserver.getLoginRoles"/>
   </DataView>
</ObjectView>
The objects tree shows the Logins node and its child nodes probe, sa and tester. The Logins node has the object type Logins, and the three child nodes have the object type Login.
The XML above defines the views for these two types. Opening the Logins node shows the view for <ObjectView type="Logins">, and opening probe, sa or tester shows the view for <ObjectView type="Login">.
In the example, sa is selected. The object view shows the data views as these tabs:
- Info
- Databases
- Roles
XML element - ObjectView
The ObjectView element belongs to an object type, and contains the DataView elements that are shown when an object of that type is selected in the objects tree. This is the ObjectView element for the Login object type:
<ObjectView type="Login">
  ...
</ObjectView>
When you select a node in the objects tree, DbVisualizer shows the ObjectView with the matching type. The attributes of ObjectView are:
| Attribute | Description |
|---|---|
type | Required. The object type, as declared in the GroupNode and DataNode elements in ObjectsTreeDef. |
layout | How the data views are arranged: tilevertical <n>, tilehorizontal <n> or collapse. See below. |
drop-on-condition | Removes the element when a condition is met. See drop-on-condition in Conditional Processing. |
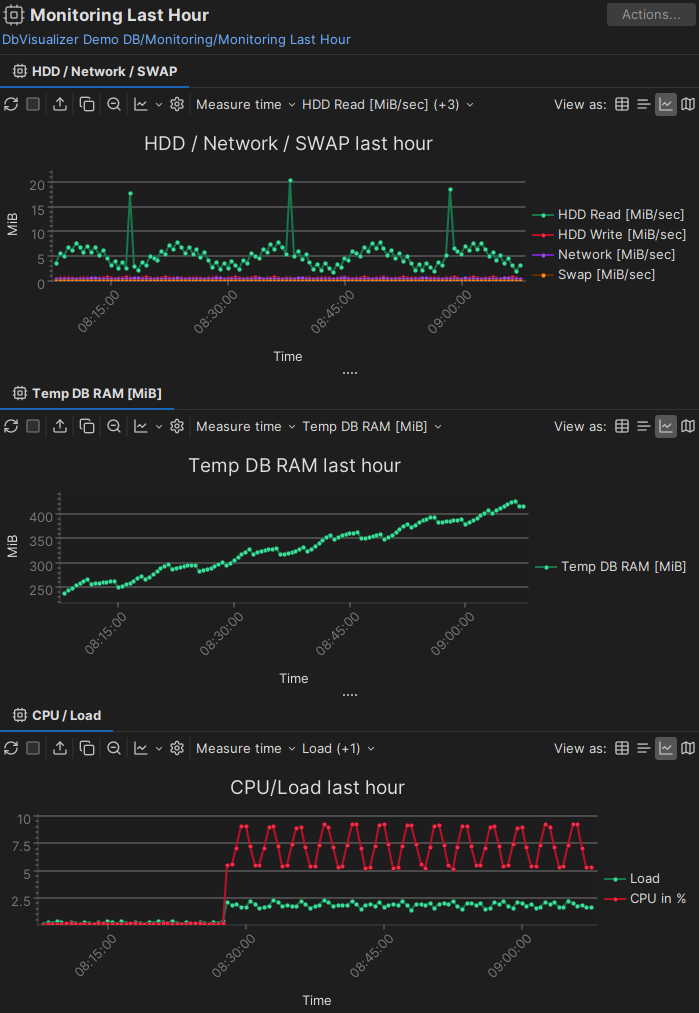
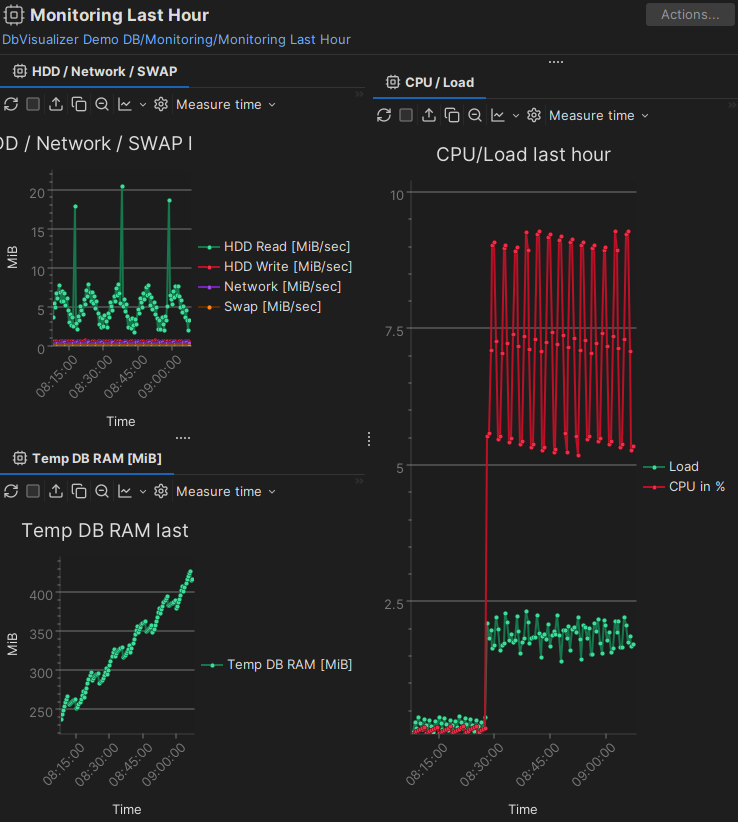
Use the layout attribute to show the data views side by side, either vertically or horizontally. The optional number <n> sets how many data views are in the first column or row. Without the layout attribute, the data views are shown as tabs in a single tab group:
layout="tilevertical": all tabs in a single column | layout="tilevertical 2": two tabs in the first column and the rest in the second column |
|---|---|
 |  |
layout="tilehorizontal": all tabs in a single row | layout="tilehorizontal 2": two tabs in the first row and the rest in the second row |
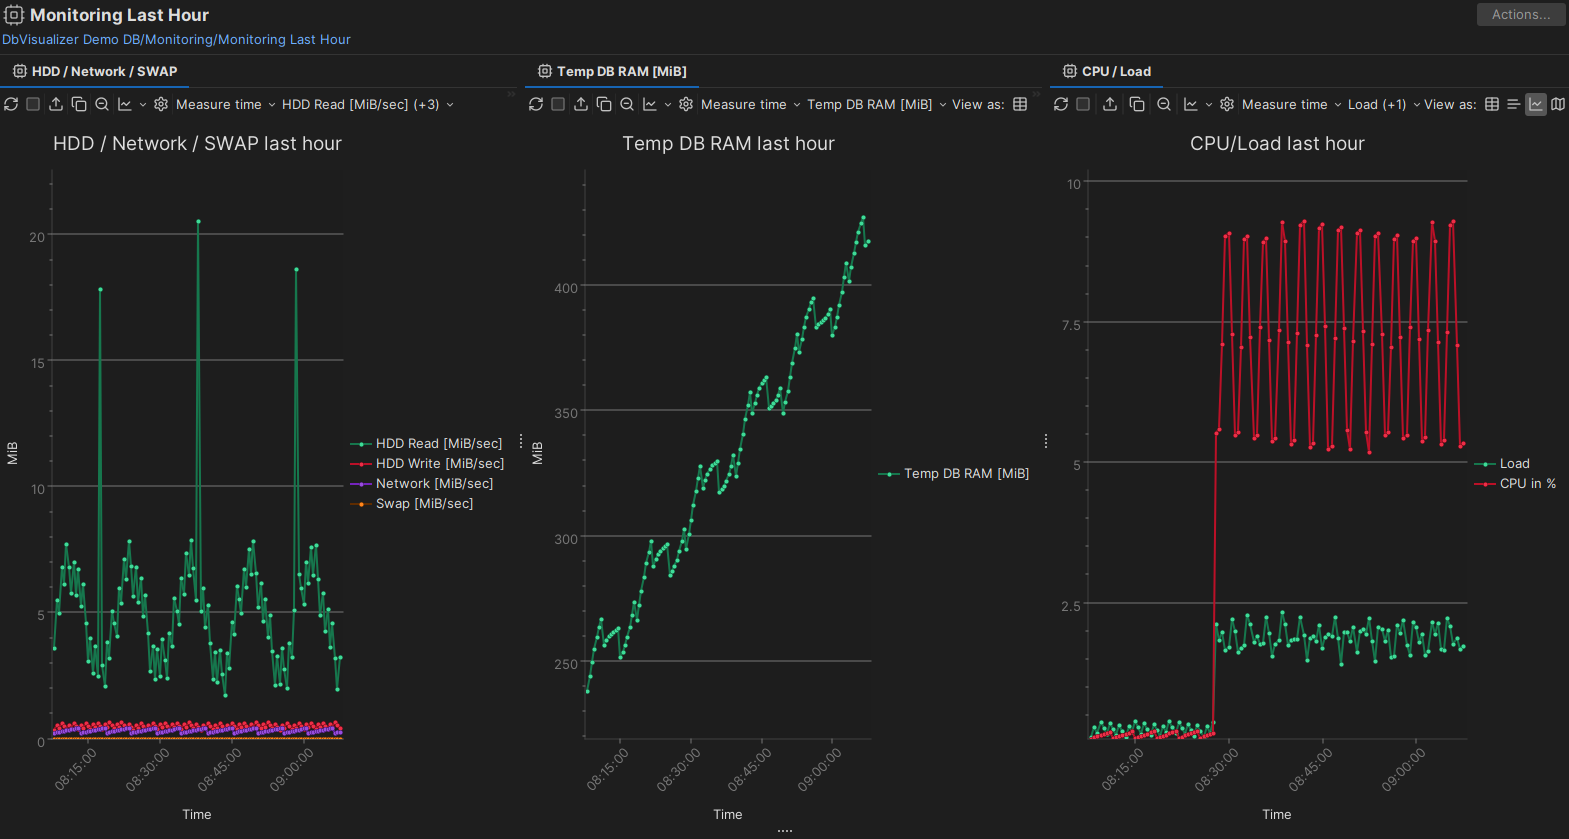 | 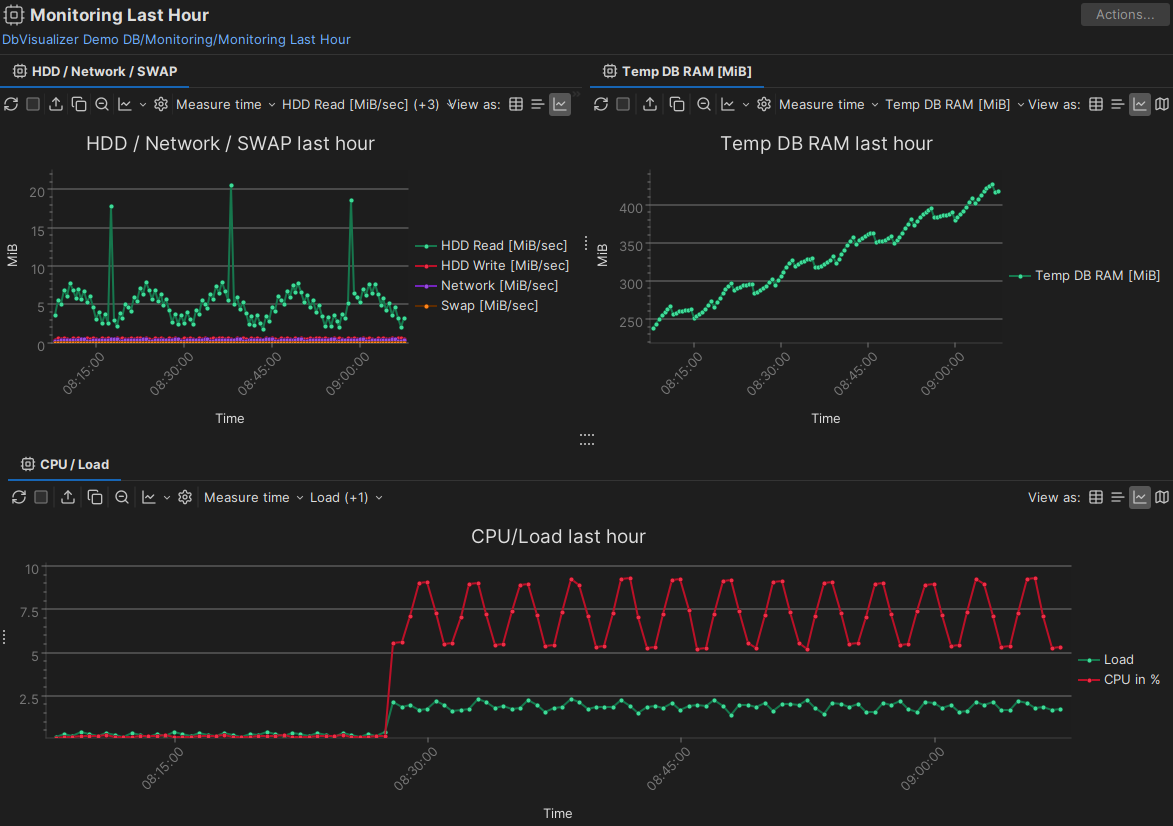 |
The tile examples above use the chart viewer for the data views, but you can tile any viewer.
XML element - DataView
The DataView element is similar to the DataNode element in ObjectsTreeDef. It defines the SQL command to run, the label, the viewer that presents the data, and other properties. These are the DataView elements for the Login object type:
<ObjectView type="Login">
  <DataView id="sqlserver-login-info" icon="Info" label="Info" viewer="node-form"/>
  <DataView id="sqlserver-login-databases" icon="Databases" label="Databases" viewer="grid">
    <Command idref="sqlserver.getLoginDatabases"/>
  </DataView>
  <DataView id="sqlserver-login-roles" icon="Roles" label="Roles" viewer="grid">
    <Command idref="sqlserver.getLoginRoles"/>
  </DataView>
</ObjectView>
The viewer attribute defines how the data is presented, for example as a grid or a form. The attributes of DataView are:
| Attribute | Description |
|---|---|
id | Required. Must be unique in the profile and in the profiles it extends. Use only letters, digits and dashes. The recommended format is profileName-objectViewType-viewerLabel, for example sqlserver-login-databases. |
label | The label of the tab. |
icon | The icon, as defined in the icons.prefs files. |
viewer | The viewer that presents the data, see Viewers. |
drop-label-not-equal | Grid viewer only. Hides the grid unless the name of the selected object equals this value. |
classargs | Arguments for the viewer. |
drop-on-condition | Removes the element when a condition is met. See drop-on-condition in Conditional Processing. |
doclink | A key for a link to the user guide, for example dbvis.url.ug.table-data. |
order-before | Places this data view before another element in the same ObjectView. The value is an index starting at 0, or the id of the other element. For example, order-before="sqlserver-login-databases". |
order-after | Places this data view after another element in the same ObjectView. The value is an index starting at 0, or the id of the other element. |
Viewers
The viewer attribute of a DataView defines how the data is presented. These are the viewers:
| Viewer | Description |
|---|---|
chart | A result set as a chart. Pro only. |
ddl | The DDL of the object. Pro only. |
document-data | The documents in a collection, for document databases. |
form | A result set as a form. |
grid | A result set as a grid. |
key-data | Key-value data where the keys can be split into levels, for example in Redis. |
message | A message. |
navigator | The Navigator tab. Pro only. |
node-form | The data of the selected node. |
node-text | The value of one variable of the selected node, as text. |
procedure-editor | The procedure editor. Pro only. |
system-time-data | The data of a system-versioned table, filtered by system time. |
table-data | The Data tab of a table. |
table-refs | The references graph of a table. |
tables-refs | The references graph of several tables. |
table-rowcount | The row count of a table. |
text | One column of a result set as text. |
In DbVisualizer Free, a Pro-only viewer shows a message instead of the data.
This example uses the viewer attribute:
<ObjectView type="Login">
  <DataView id="sqlserver-login-info" label="Info" viewer="node-form"/>
</ObjectView>
You can nest DataView elements. The nested data views are shown in the lower part of the view.
Viewer - chart
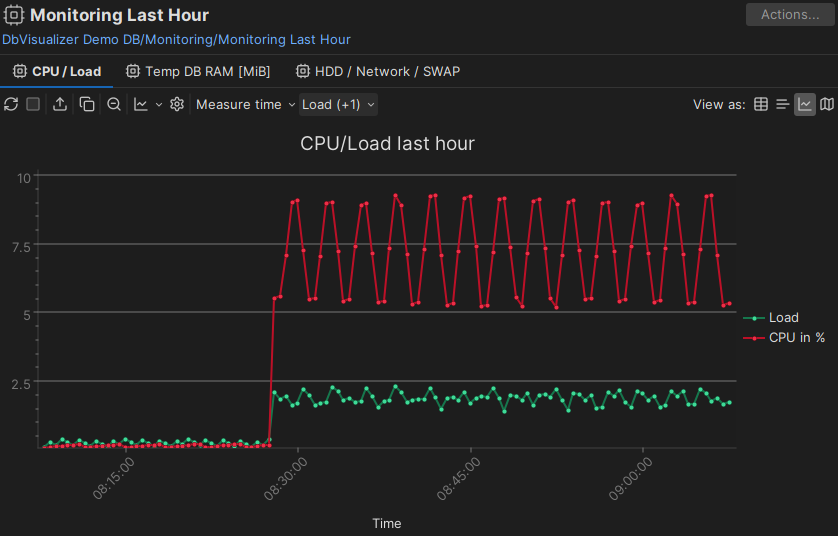
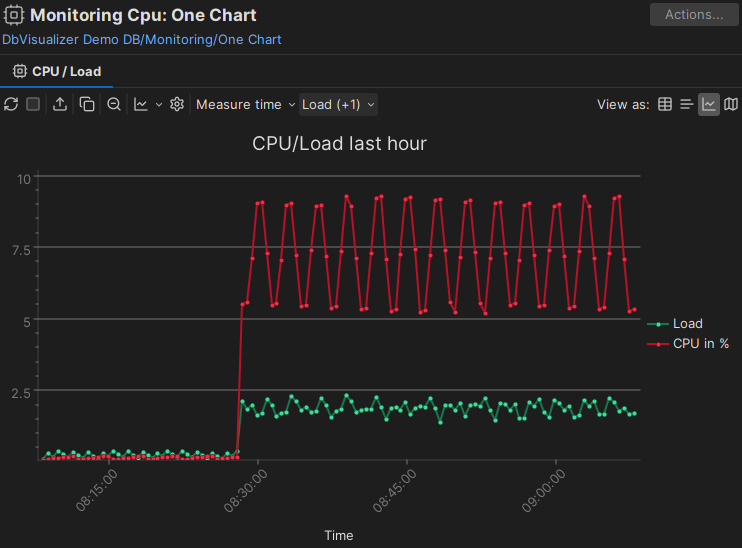
The chart viewer shows a result set as a chart. Use it, for example, for monitoring metrics and statistics. Together with the layout attribute of ObjectView, you can create dashboards with charts and other viewers.
This is an example of a DataView using the chart viewer:
<DataView id="exasol-monitoringlastday-cpu" icon="Monitoring"
   label="CPU / Load" viewer="chart">
   <Command idref="exasol.getMonitorLastDay"/>

   <Input name="displayMode" value="chart"/>
   <Input name="toolbarVisible" value="false"/>

   <Input name="chart.category_column" value="Measure time"/>

   <Input name="chart.serie.0.name" value="Load"/>
   <Input name="chart.serie.0.visible" value="true"/>
   <Input name="chart.serie.1.name" value="CPU in %"/>
   <Input name="chart.serie.1.visible" value="true"/>

   <Input name="chartTitle" value="CPU/Load last hour"/>
   <Input name="xaxisHandleTimeAsText" value="false"/>
   <Input name="xaxisTitle" value="Time"/>
   <Input name="yaxisTitle" value=""/>
</DataView>
This is the Command used in the example:
<Command id="exasol.getMonitorLastDay">
   <SQL>
      <![CDATA[
SELECT
    MEASURE_TIME 'Measure time',
    LOAD 'Load',
    CPU 'CPU in %',
    TEMP_DB_RAM 'Temp DB RAM [MiB]',
    HDD_READ 'HDD Read [MiB/sec]',
    HDD_WRITE 'HDD Write [MiB/sec]',
    NET 'Network [MiB/sec]',
    SWAP 'Swap [MiB/sec]'
FROM
    EXA_STATISTICS.EXA_MONITOR_LAST_DAY
WHERE  MEASURE_TIME >= add_minutes(CURRENT_TIMESTAMP,-60)
ORDER BY 1
      ]]>
   </SQL>
</Command>
This is how it looks, with the Measure time column as the category (along the X axis), and the Load and CPU in % columns as series:
You can set all the chart options that are available in the DbVisualizer GUI as parameters, using this syntax:
<Input name="displayMode" value="chart"/>
These parameters define the series in the chart.
In the chart.serie.<n> parameters, replace <n> with sequential numbers starting at 0, one for each series.
| Parameter | Default | Description |
|---|---|---|
chart.category_column | The column in the result set to use as the category. Its values are the labels along the X axis. | |
chart.serie.<n>.name | The column in the result set to show as a series. If you rename columns using aliases, use the alias. | |
chart.serie.<n>.visible | false | Whether the series is visible initially. You can still select it in the series drop-down list of the chart. |
chart.serie.<n>.label | An alternative name for the series. |
The following parameters control the appearance and content of the chart. Where no default is given, the default comes from your chart settings or the current theme.
| Parameter | Description | Values |
|---|---|---|
displayMode | How the result set is shown first. The user can change it using the toolbar or the right-click menu. | chart (default), grid or text |
toolbarVisible | Whether the toolbar is visible. | true or false (default) |
statusbarVisible | Whether the status bar in grid or text mode is visible. | true or false (default) |
| Chart | ||
chartTitle | The chart title, shown in large text at the top. | |
chartType | The type of chart. | result-set-chartviewer-line-chart-command (default), result-set-chartviewer-point-chart-command, result-set-chartviewer-area-chart-command, result-set-chartviewer-stacked-area-chart-command, result-set-chartviewer-bar-chart-command, result-set-chartviewer-stacked-bar-chart-command or result-set-chartviewer-pie-chart-command |
chartFont | The font for all text in the chart. | <FontFamily>-<Style>-<Size>, for example Lucida Grande-plain-13 |
chartTopBackground | The top background color, the start color of a gradient background. | For example #ffffff |
chartBottomBackground | The bottom background color, the end color of a gradient background. | For example #ccffcc |
| Legend | ||
legendVisible | Whether a legend with the labels of all series is shown. | true (default) or false |
legendLocation | The position of the legend. | North, West, South or East (default) |
| X axis | ||
xaxisTitle | The X axis title, shown below the X axis. | |
xaxisTitleVisible | Whether the X axis title is shown. | true (default) or false |
xaxisRotation | The rotation of the X axis labels. | Horizontal, 45 (default) or Vertical |
xaxisLabelOverlap | Whether X axis labels may overlap. | true or false (default) |
xaxisMajorGridLines | Whether X axis major grid lines are shown. | true or false (default) |
xaxisHandleTimeAsText | Whether date, time and timestamp values are handled as text. | true (default) or false |
| Y axis | ||
yaxisTitle | The Y axis title, shown to the left of the Y axis. | |
yaxisTitleVisible | Whether the Y axis title is shown. | true (default) or false |
yaxisMajorGridLines | Whether Y axis major grid lines are shown. | true (default) or false |
yaxisMinorGridLines | Whether Y axis minor grid lines are shown. | true or false (default) |
yaxisAutoStartValue | Whether the Y axis start value is based on the data. | true (default) or false |
yaxisStartValue | The start value of the Y axis. | 0.0 (default) |
yaxisAutoEndValue | Whether the Y axis end value is based on the data. | true (default) or false |
yaxisEndValue | The end value of the Y axis. | 0.0 (default) |
yaxisNumberFormat | The number format of the value labels, see DecimalFormat. | For example #,##0.# |
| Series | ||
chartColorScheme | The color scheme of the series. Use the name exactly as shown. | Qualitative Set1 (9), Qualitative Set3 (10), Diverging Spectral (10), HTML Color Names (140), New Tau (10), Tau (20), Tau Color Blind (10), Divirgent Color Scale (13), DbVis Light (10) or DbVis Dark (10) |
chartShadow | Whether series have a shadow border. | true or false (default) |
| Line and area chart | ||
chartLineType | Straight or smooth lines in line charts. | Straight (default) or Smooth |
chartLineWidth | The line width in pixels. | 2 (default) |
chartShowPoints | Whether a point is shown for each value. | true (default) or false |
chartShowPointLabels | Whether point labels are shown. | true or false (default) |
| Bar chart | ||
chartBarType | How bars are rendered. | Flat (default), Raised, Cylinder or 3D |
chartBarGap | The gap in pixels between bars. | 2 (default) |
chartBarGroupGap | The gap in pixels between groups of bars. | 4 (default) |
| Pie chart | ||
chartPieType | How the pie is rendered. | Flat (default), Raised or 3D |
chartPieLabelType | How slice labels are shown. | Line Labels (default), Simple Labels or No Labels |
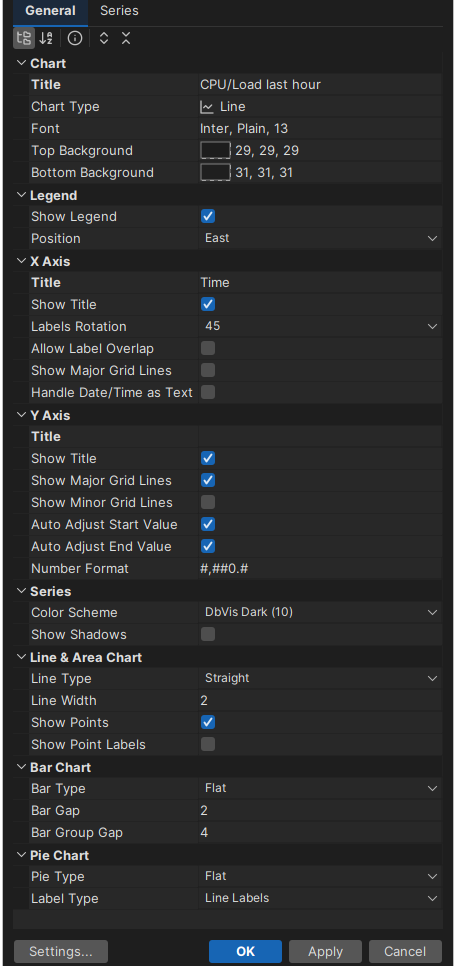
For reference, these are the same settings, in the same order, in the chart settings in the DbVisualizer GUI:
Viewer - ddl
The ddl viewer works only for object types that DbVisualizer supports DDL generation for. It shows the DDL of the object, based on its catalog, schema and objectname variables.
<DataView id="oracle-table-ddl" icon="Source" label="DDL" viewer="ddl">
   <Input name="formatSQL" value="true"/>
   <Input name="objectType" value="Table"/>
</DataView>
The formatSQL parameter sets whether the DDL is formatted. The objectType parameter tells some DDL generators which object type to generate DDL for.
Viewer - form
The form viewer shows the rows of a result set in a form. If there are several rows, they are shown in a list. Selecting a row shows all its columns in the form.
This is an example of the form viewer:
<DataView id="mysqlbase-table-info" icon="Info" label="Info" viewer="form" order-before="0">
   <Command idref="mysqlbase.getTable">
      <Input name="catalog" value="${catalog}"/>
      <Input name="table" value="${objectname}"/>
   </Command>
</DataView>
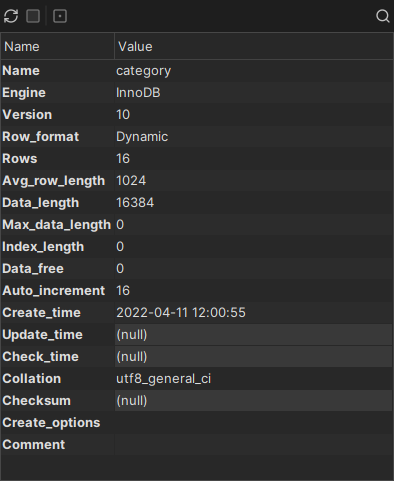
This is the Info tab based on the definition above:
Viewer - grid
The grid viewer shows a result set in a grid with the standard grid features, such as search, copy, fit columns and export. The result set is shown as it is returned by the Command and any Output processing.
This is an example of the grid viewer:
<DataView id="mysqlbase-table-columns" icon="Columns" label="Columns" viewer="grid" order-after="mysqlbase-table-info">
   <Command idref="mysqlbase.getColumns">
      <Input name="catalog" value="${catalog}"/>
      <Input name="table" value="${objectname}"/>
   </Command>
</DataView>
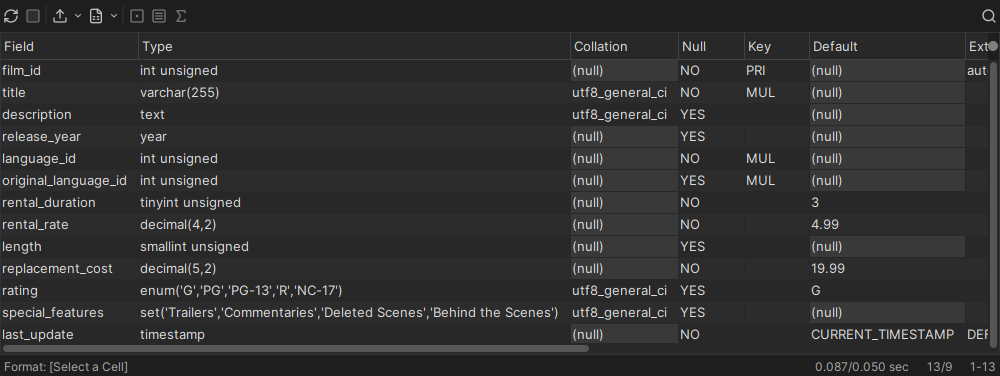
This is the grid viewer based on the definition above:
Drill-down view
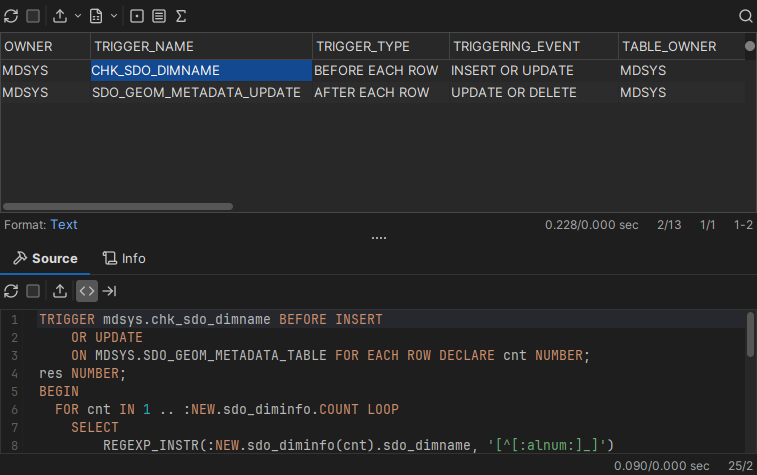
You can nest viewers in a grid viewer to create a drill-down view. For example, a grid viewer lists all triggers, and selecting a row shows the source of that trigger:
<DataView id="oracle-table-triggers" icon="Trigger" label="Triggers" viewer="grid">
   <Command idref="oracle.getTriggers">
      <Input name="owner" value="${schema}"/>
      <Input name="condition" value="${triggersCondition}"/>
   </Command>
   <DataView id="oracle-table-triggers-source" icon="Source" label="Source" viewer="text">
      <Input name="dataColumn" value="text"/>
      <Input name="formatSQL" value="true"/>
      <Command idref="oracle.getTriggerSource">
         <Input name="owner" value="${OWNER}"/>
         <Input name="name" value="${TRIGGER_NAME}"/>
      </Command>
   </DataView>
   <DataView id="oracle-table-triggers-info" icon="Info" label="Info" viewer="node-form"/>
</DataView>
- The first
DataViewelement defines the top grid viewer, labeled Triggers, and the command that gets its result set. - The next
DataViewis a nested text viewer labeled Source, with parameters for the viewer and the command that gets the trigger source. The parameters of this command refer to columns in the top grid. Because the viewer is nested, it is updated when you select a row in the top grid. - The third
DataView, labeled Info, is shown as a tab next to Source, with more information about the selected trigger.
This is how the example looks:
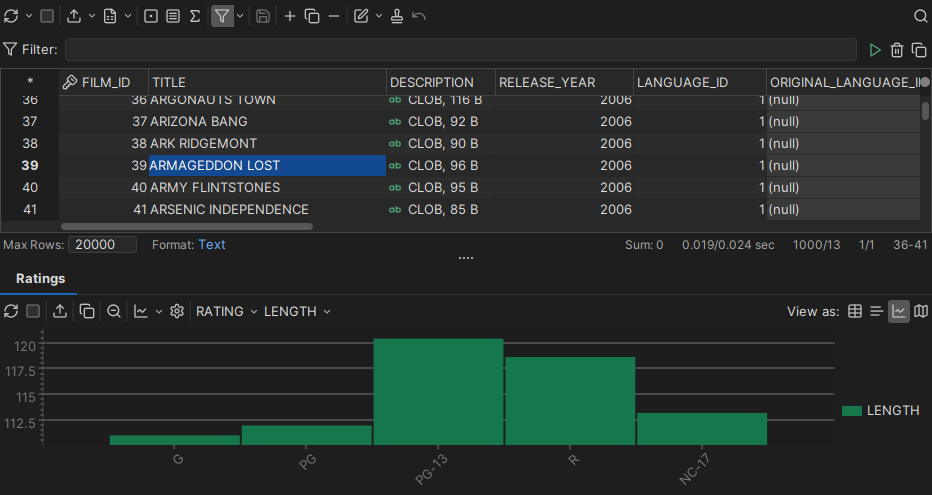
You can also use a chart as the drill-down viewer, showing data for the row selected in the top grid:
Adding custom menu items in the grid
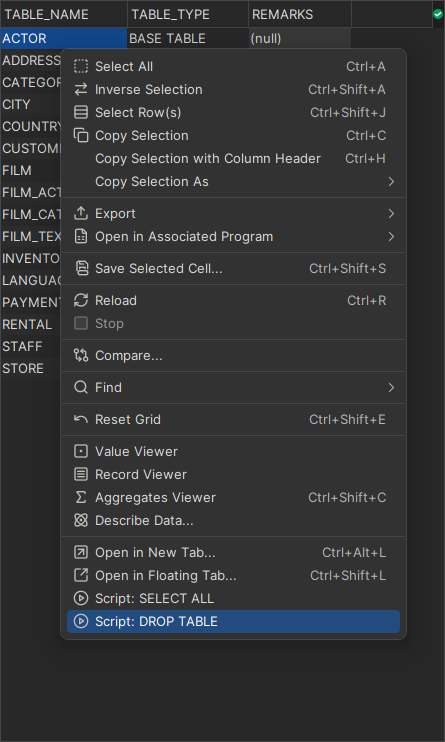
You can add your own items to the right-click menu of the grid. They are shown last in the menu.
<Input name="menuItem" value="Open in New Tab...">
   <Input name="action" value="open-object-in-new-tab-command ${schema||OWNER}${object||TABLE_NAME}"/>
</Input>
<Input name="menuItem" value="Open in Floating Tab...">
   <Input name="action" value="open-object-in-floating-tab-command ${schema||OWNER}${object||TABLE_NAME}"/>
</Input>
<Input name="menuItem" value="Script: SELECT ALL">
   <Input name="command" value="select * from ${schema||OWNER}${object||TABLE_NAME}"/>
</Input>
<Input name="menuItem" value="Script: DROP TABLE">
   <Input name="command" value="drop table ${schema||OWNER}${object||TABLE_NAME}"/>
</Input>
The <Input name="menuItem"> element defines a menu item. Its value is the label of the item. The child Input element with name="command" is the SQL statement to create for each selected row. The menu item doesn't run the SQL. It loads the statements into a new SQL Commander tab, where you run them yourself.
A child Input element with name="action" runs a predefined action instead. These are the actions:
open-object-in-new-tab-commandopen-object-in-floating-tab-command
The variables in the SQL refer to columns in the result set. The user can select any cells in the grid. Only the rows of the selection are used, since the columns are given in the menuItem definition.
The variables in the examples have the form ${schema||OWNER} and ${object||TABLE_NAME}. The part before || (catalog, schema or object) tells DbVisualizer what the column contains, and the part after it is the column name. DbVisualizer uses this to decide whether to delimit and qualify the identifiers, as set in the connection properties.
Here is an example:
Setting initial max column width
Some result sets have wide columns. This parameter sets an initial maximum width for all columns in the grid:
<Input name="columnWidth" value=""/>
Viewer - message
The message viewer shows a message.
<DataView id="mimer-auto-properties" icon="properties" label="Mimer SQL Auto" viewer="message">
   <Message>
      <![CDATA[
<html>
Mimer SQL Auto database server type has no capabilities to list the contents of the database schema. <br/>
Please enter the precompiled statement names in the command window to perform operations
towards the database.
</html>
      ]]>
   </Message>
</DataView>
You can combine it with conditions, as in this example:
<If test="#ROLE_IS_SECURITY_ADMIN eq 1">
   <DataView id="snowflake-users-users" icon="Users" label="Users" viewer="grid">
      <Command idref="snowflake.getUsers">
         <Input name="catalog" value="${catalog}"/>
      </Command>
   </DataView>
</If>
<Else>
   <DataView id="snowflake-users-users" icon="Users" label="Users" viewer="message">
      <Message>
         <![CDATA[
<html>
Insufficient privileges. SECURITYADMIN Role is required to view Users.
</html>
         ]]>
      </Message>
   </DataView>
</Else>
Viewer - navigator
The navigator viewer defines the Navigator tab for tables.
<DataView id="generic-table-navigator"
          icon="Navigator" label="Navigator" viewer="navigator"/>
Viewer - node-form
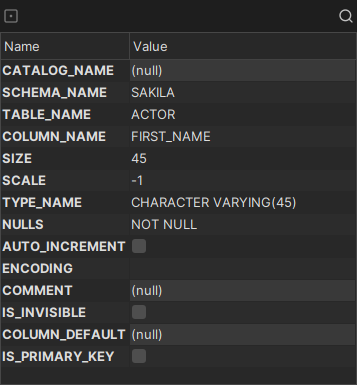
The node-form viewer shows all data (variables) of the selected node. This is how it looks:
Hiding columns
To hide some of the data of the object in the node form, use the hidecolumn parameter. Repeat it for each variable to hide.
<Input name="hidecolumn"
       value="oracle.getKeys.TABLE_OWNER"/>
Viewer - node-text
The node-text viewer shows the value of a single variable of the selected node as read-only text.
Use it for large values, such as source code or SQL statements, when the data is already loaded and no query is needed.
<DataView id="presto-base-queries-queries-query"
    icon="Query" label="Query" viewer="node-text">
   <Input name="dataColumn" value="text"/>
   <Input name="formatSQL" value="true"/>
</DataView>
The dataColumn parameter is required. It names the column to show:
<Input name="dataColumn" value="query"/>
Enable SQL formatting of the data
The node text viewer can format the SQL that it shows. Use the formatSQL parameter to format the data when it is first shown. Without formatSQL, the data is not formatted initially.
<Input name="formatSQL" value=""/>
Viewer - procedure-editor
The procedure-editor viewer works only for object types that DbVisualizer supports it for. It opens the procedure editor for the selected code object, such as a procedure, function, package or package body.
<DataView id="mimer-function-functioneditor" classargs="FUNCTION" icon="SourceEditor" label="Function Editor" viewer="procedure-editor"/>
Viewer - table-data
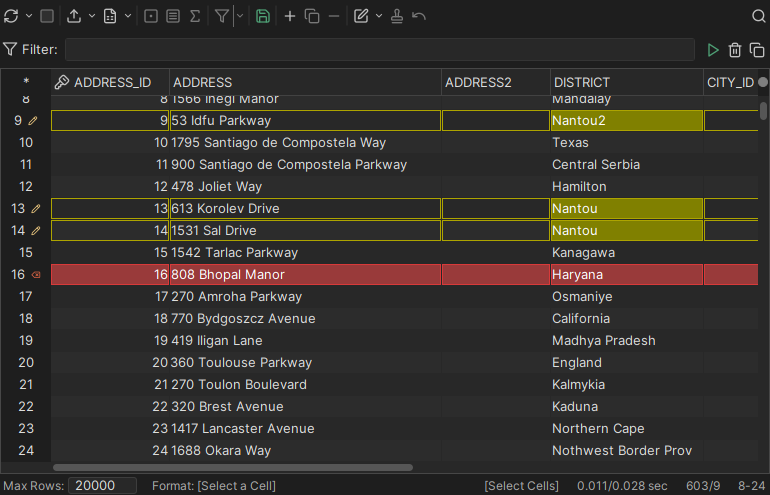
The table-data viewer shows the data of a table in a grid, with features such as filtering and editing. Editing requires DbVisualizer Pro. This viewer is the Data tab.
The viewer gets the data using a SELECT * FROM table statement, so the object type must support this statement.
Set the Database Type of the connection to match the database. The viewer delimits the identifiers (schema, database and table) automatically, and delimiters differ between databases, so the wrong database type can cause an error.
This is an example of the table-data viewer:
<DataView id="h2-view-data" icon="Data" label="Data" viewer="table-data"/>
This is the Data tab based on the definition above:
Disable data editing
By default, the table-data viewer checks whether the data can be edited. If it can, buttons for editing are shown in the toolbar. To turn off editing in the viewer, use this parameter:
<DataView ...>
   <Input name="editDisabled" value="true"/>
</DataView>
Trim cell values
The data is shown as returned by the database. Some databases pad values with spaces. To remove leading and trailing spaces from the value in each cell, use this parameter:
<DataView ...>
   <Input name="trimCellValues" value="true"/>
</DataView>
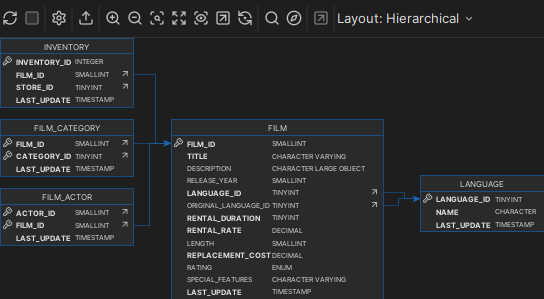
Viewer - table-refs
The table-refs viewer shows the references graph of the current object. The object must support referential integrity constraints, as a table does.
This is an example of the table-refs viewer:
<DataView id="generic-table-references" icon="References" label="References" viewer="table-refs"/>
This is the References tab based on the definition above:
Viewer - tables-refs
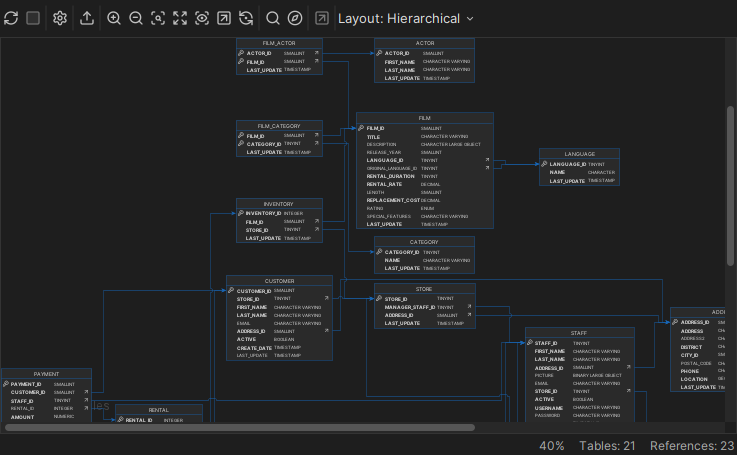
The tables-refs viewer shows the references graph of the tables in the result set. The objects must support referential integrity constraints, as tables do. This is an example of the tables-refs viewer:
<DataView id="oracle-tables-references" icon="References" label="References" viewer="tables-refs">
   <Command idref="oracle.getTables">
      <Input name="owner" value="${schema}"/>
      <ProcessDataSet action="renamecolumn" index="OWNER" name="TABLE_SCHEM"/>
      <ProcessDataSet action="renamecolumn" index="TABLE_NAME" name="TABLE_NAME"/>
   </Command>
</DataView>
This is the References tab based on the definition above:
Viewer - table-rowcount
The table-rowcount viewer shows the number of rows in a table.
The viewer gets the row count using a SELECT COUNT(*) FROM table statement, so the object type must support this statement.
Set the Database Type of the connection to match the database. The viewer delimits the identifiers (schema, database and table) automatically, and delimiters differ between databases, so the wrong database type can cause an error.
This is an example of the table-rowcount viewer:
<DataView id="generic-table-rowcount" icon="RowCount" label="Row Count" viewer="table-rowcount"/>
Viewer - text
The text viewer shows the data in one column of a result set as read-only text. Use it for large values, such as source code or SQL statements. If the result set has several rows, the viewer shows the combined data of the column in all rows.
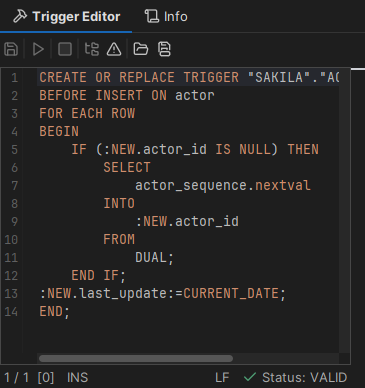
This is an example of the text viewer:
<DataView id="oracle-table-triggers-source" icon="Source" label="Source" viewer="text">
   <Input name="dataColumn" value="text"/>
   <Input name="formatSQL" value="true"/>
   <Input name="newline" value=""/>
   <Command idref="oracle.getTriggerSource">
      <Input name="owner" value="${OWNER}"/>
      <Input name="name" value="${TRIGGER_NAME}"/>
   </Command>
</DataView>
This is the Source tab based on the definition above:
Specify what column to browse
By default, the text viewer shows the first column. Use the dataColumn parameter to set the column, by name or by index (starting at 1 from the left).
<Input name="dataColumn" value=""/>
Enable SQL formatting of the data
The text viewer can format the SQL that it shows. Use the formatSQL parameter to format the data when it is first shown. Without formatSQL, the data is not formatted initially. The values are true, false and disable. The disable value turns off the formatting option in the viewer.
<Input name="formatSQL" value=""/>
Adding newline to each row
When the result set has several rows, the newline parameter sets the characters between the rows. A \n in the value is converted to a newline. By default, there is nothing between the rows.
<Input name="newline" value="\n"/>
<Input name="newline" value="as-sql"/>
The as-sql value adds the SQL statement delimiter and a newline at the end of each row.
XML element - Command
See commands.
XML element - Input
Some viewers support the Input element. See the sections for each viewer.
XML element - Message
The Message element defines a message that is shown at the top of the viewer. The message can contain HTML tags such as <b> (bold), <i> (italic) and <br> (line break).
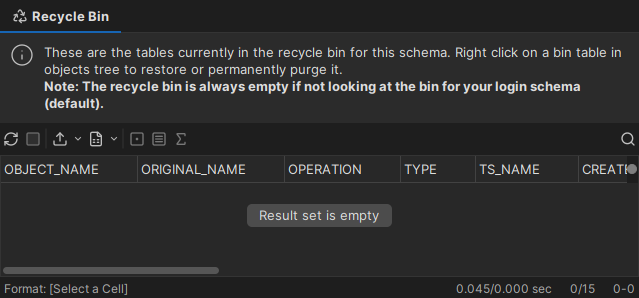
This is an example of a message in a grid viewer:
<ObjectView type="RecycleBin">
   <DataView id="oracle-recyclebin-recyclebin" icon="RecycleBin" label="Recycle Bin" viewer="grid">
      <Command idref="oracle.getRecycleBin">
         <Input name="schema" value="${schema}"/>
         <Input name="login_schema" value="${dbvis-defaultCatalogOrSchema}"/>
      </Command>
      <Message>
         <![CDATA[
<html>
These are the tables currently in the recycle bin for this schema. Right click on a bin
table in objects tree to restore or permanently purge it.
<b>Note: The recycle bin is always empty if not looking at the bin for your
login schema (default).</b>
</html>
         ]]>
      </Message>
   </DataView>
</ObjectView>
This is the Recycle Bin tab based on the definition above: