Analyzing Query Performance (Explain Plan)
Only in DbVisualizer Pro
This feature is only available in the DbVisualizer Pro edition.
Explain Plan shows how the database plans to execute a query: for example, which indexes it uses, how it joins the tables, and whether it has to read a whole table. Use it to find out why a query is slow.
- Write the query in the SQL Commander editor.
- Click Execute Explain Plan in the toolbar, or press
Ctrl+Alt+Enter(Cmd+Option+Enteron macOS). - Look at the plan in the results area.
Explain Plan works like executing statements: you can select statements, run a script or open a file. To compare plans, for example before and after you add an index, pin the result tabs.
Depending on the database, the plan is shown as a tree, a graph or text, and the information in it differs.
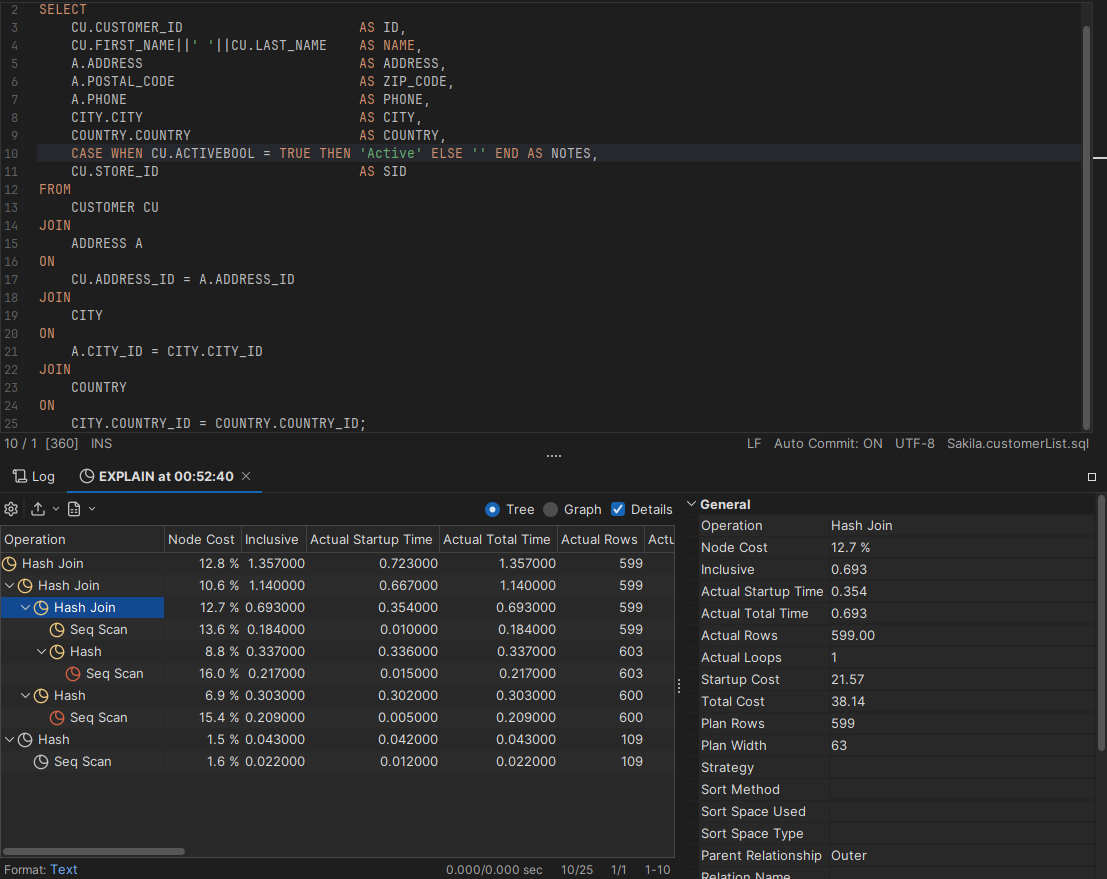
In the tree view, colors on each node show its relative cost. Select a node to see its details, when Details is selected. Point to a column header to see what the column means.
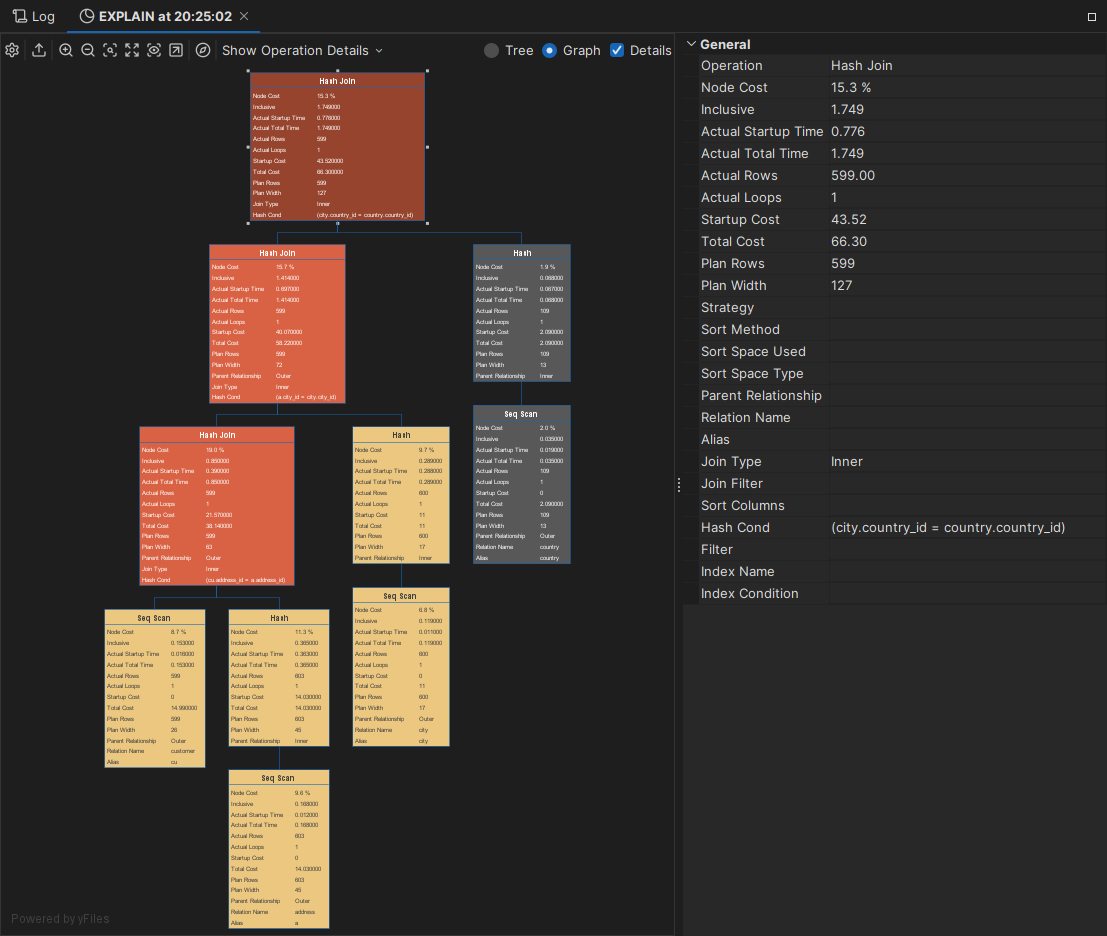
In the Graph view, the color of each node shows its relative cost, and you can select a node to see its details. Use the toolbar to zoom, choose the level of detail, and export or print the graph.
For some databases, you can change how Explain Plan works in the Explain Plan category of the connection properties.