Using the Log Tab
The Log tab shows the progress and the result of each statement when you execute a script in SQL Commander. The same log is used when you import data, export a schema or database, work in the procedure editor and run database object actions, with small differences. How much an error message tells you depends on the database and the driver.
Following the execution
While a script runs, the status bar of the log shows the number of successful and failed statements, the time used, and the number of statements per time unit. The progress bar shows how much of the script has been executed. When the script isn't preprocessed, or when you use @run, the statements aren't counted, so the progress bar only shows that the script is running. See Executing a Script File.

While a script runs, you can't search, sort, filter, expand rows, use the links to the editor, or save the log.
- Auto Scroll keeps the newest entry in view. Turn it off in the toolbar or the right-click menu.
- Auto Clear Log clears the log when you start an execution. If you turn it off, the entries of earlier executions are kept.
When the log has very many entries, the oldest ones are removed from the grid, and Truncated is shown in the status bar. The STARTED and FINISHED entries of earlier executions are kept, with an entry that tells how many entries were removed. All entries are still saved, see Copying and saving the log.
Finding failed statements
When the execution is done, the rows of failed statements are expanded to show the whole message and statement. To expand other rows too, use Auto Resize Row Heights in the right-click menu. A cell that has more lines ends with .... Double-click a row to expand or collapse it.
To go to the next or previous failed statement, select Goto Next Failed or Goto Previous Failed in the right-click menu.
To see only the failed statements, click the filter icon in the Status column header, and double-click FAILED. You can filter on any column in the same way, or select (Custom) to write your own condition. To search the text of all entries, use the search field.
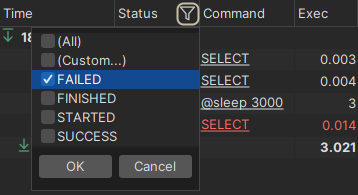
Filters don't apply to the STARTED and @run entries, since they group the entries below them.
Going to a statement in the editor
In the Command column, each statement is a link. Click it to select the statement in the editor. For a failed statement, the Status column is also a link. Click it to go to the statement, or, if the database reports where the error is, to the position of the error. If a statement has several errors, select one in the menu that opens.
For an @run command, click the link to open the script file in a new SQL Commander tab.
The same actions are in the right-click menu: Highlight Statement and Highlight Failed Statement. For how errors are shown in the editor, see Locating SQL Errors.
Fixing errors using the AI Assistant
Only in DbVisualizer Pro
This feature is only available in the DbVisualizer Pro edition.
When the AI Assistant is turned on, it can explain an error and suggest a fix. Select the error in the log and click Explain Error Using AI Assistant in the toolbar, or click the light bulb next to the failed statement in the editor and select Analyze Error. The answer opens in a new chat in the AI Assistant.
Copying and saving the log
Select the entries, and use these actions in the right-click menu:
- Load Selected Commands into Editor and Load Selected Commands in New Editor copy the statements to the current or a new SQL Commander tab.
- The copy actions copy the entries as text, for example to share them. Copy Selection copies only the selected cells, separated by tabs, as in other grids.
- Save Log to Text File saves all entries of the execution, also those removed from the grid.
- Load Log (.dson) File opens a saved log file in the grid.
The saved entries are removed when you clear the log, when Auto Clear Log is on and you start a new execution, and when you close the SQL Commander tab.
Writing to the log
To write your own messages to the log, use the @echo client-side command. The message can contain variables:
@echo Today is ${dbvis-date}$ and the time is ${dbvis-time}$;
For example, show the value returned by a function or procedure:
@call ${STATUS||(null)||String||noshow dir=out}$ = "HR"."GET_STATUS"(1002);
@echo STATUS: ${STATUS}$;
Changing the time format
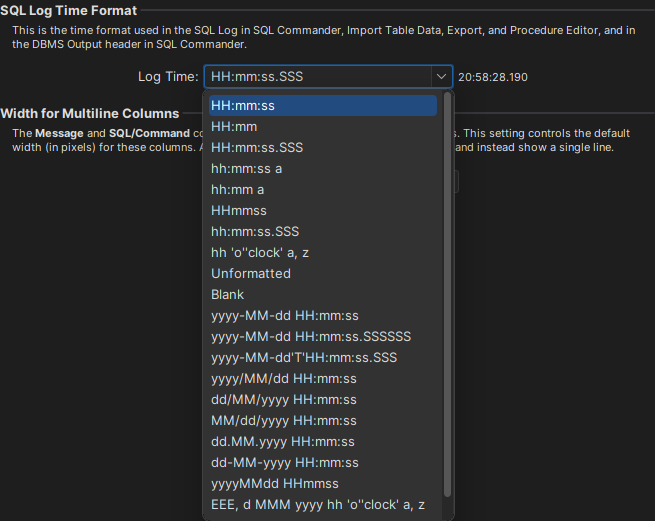
By default, the Time column shows hours, minutes and seconds. To show the date, milliseconds or another format, use the General / SQL Commander / SQL Log category in Tools → Tool Properties.